If you get a chance you may briefly look at old articles related to this topic as I will be briefly referencing them or quickly summarizing portions of my configuration.
Part 1: Detecting Outbound Connections – Basic write-up on how sysmon can detect application callbacks and may be used to find malware running on systems.
Part 2: Logstash + Threat Intelligence – This write-up demonstrates how we can add threat intel data to elasticsearch via Logstash and a simple python script.
Part 3: Private Connections & Microsoft IP addresses – This article discusses how we can use Logstash (cidr) function to label internal networks and Microsoft connections to make sure we can filter non-private addresses to make our searches easier.
This article will try to be in-depth in discussing how we can create a good base configuration for Sysmon and then leverage a Logstash configuration to further filter known and expected connections and later being able to find the interesting items. Most Malware communicates to the internet over ports 443, 80; however, other Malware may communicate over ports 22, 25, 137-139, 53, or 445. In addition, I want to make sure I’m monitoring other kind of network connections to understand how my endpoints are communicating (For example those systems communicating with printers, or users uploading ftp documents to vendors). We will be casting a “wide-net” and later filter the known and expected connections.
Challenges: Endpoints are really noisy
Once you create your Sysmon configuration and include Event ID 3 – Network connections, you will realize how chatty your endpoints are, web browsers, and other office-related products will consume most of your Sysmon logs within the Event viewer.
Here’s my observations
- Your Web-browsers such as chrome.exe, firefox.exe, iexplorer.exe, etc.. will make for most of your connections being logged. I recommend you filter these out initially as they might not provide much value. If you have a proper web-filtering solution, then look at those logs instead.
- Microsoft related products will be very chatty. Either filter these out, or create a separate label for these (I recommend reading Part 3: Private Connections & Microsoft IP addresses article to get a better idea of what I’m referring to). This way you can either filter these items or just be able to exclude them in future Kibana searches ( I will touch more on this later).
- 3rd party applications such as Adobe, Flash, VMWare, Citrix, Apple, GotoMeeting, Dropbox…etc.. will also create a large amount of network events. This is true for software that synchronizes periodically such as personal storage software.
- Vendor-software running in your environment will also generate some level of network connections within the endpoint.
- Your Antivirus/Anti-Malware will make up for the rest of your network connections, specially when they’re communicating to the definition server or checking back in.
- Lastly, the interesting and juicy executables we intend to find after we go through the hassle of filtering these known and expected connections.
So now that we know what to do, let’s look at ways we can accomplish our end goal of being able to find interesting connections.
How to Approach this problem
3 ways you can approach this:
- You can either filter most of your executables within the Sysmon XML configuration file. The upside is that this will ensure that our logs are filtered at the endpoint and thus reducing the amount of logs being generated and also being sent across the network to our ELK environment. The downside of this is that Sysmon currently lacks flexibility in filtering out specific events (For example, we can’t just exclude Powershell for internal connections (RFC 1918), or other executable for that matter. You will either exclude all internal connections or not, there’s no IF, or else.
- Filter all of your connections within your Logstash configuration – Logstash is very flexible with regards filtering an executable and specific actions, the only downside about it is that the processing will be slightly slower and your configuration will grow; however, that’s not really a problem. What you have to worry is about the amount of logs being generated from hundreds or thousands of endpoints sending unfiltered Sysmon events and being handled by logstash which might cause future issues.
- A combination of both in which a good portion of static paths are filtered via Sysmon and other dynamics paths are filtered via Logstash.
Let’s go with Option 3 as more than 60% of the connections may be filtered by Sysmon and the rest may be handled by Logstash.
Let’s come up with a Sysmon configuration
<!-- Event ID 3: Network Connection -->

<NetworkConnect onmatch="exclude">
        <DestinationIp condition="contains">169.254</DestinationIp>
	<DestinationIp condition="contains">255.255.</DestinationIp>
	<DestinationIp condition="contains">239.255.</DestinationIp>
	<DestinationIp condition="contains">127.0.</DestinationIp>
	<DestinationIp condition="contains">0:0:0</DestinationIp>
<!-- Web Browsers -->
        <Image condition="end with">iexplore.exe</Image>
	<Image condition="end with">chrome.exe</Image>
	<Image condition="end with">firefox.exe</Image>
<!-- 3rd Party & Office Products -->
	<Image condition="is">C:\Program Files\Malwarebytes Anti-Malware\mbam.exe</Image>
	<Image condition="is">C:\Program Files (x86)\Adobe\Acrobat Reader DC\Reader\AcroRd32.exe</Image>
	<Image condition="contains">C:\Program Files\Adobe\</Image>
	<Image condition="contains">C:\Program Files (x86)\Adobe\</Image>
	<Image condition="contains">C:\Program Files\Google\</Image>
	<Image condition="contains">C:\Program Files (x86)\Google\</Image>
	<Image condition="contains">C:\Program Files\Microsoft Visual Studio\</Image>
    <Image condition="contains">C:\Program Files (x86)\Microsoft Visual Studio\</Image>
	<Image condition="contains">C:\Program Files\Dropbox\</Image>
    <Image condition="contains">C:\Program Files (x86)\Dropbox\</Image>
	<Image condition="contains">C:\Program Files\Common Files\Adobe\</Image>
    <Image condition="contains">C:\Program Files (x86)\Common Files\Adobe\</Image>
	<Image condition="contains">C:\Program Files\Common Files\Microsoft Office\</Image>
    <Image condition="contains">C:\Program Files (x86)\Common Files\Microsoft Office\</Image>
	<Image condition="contains">C:\Program Files\Microsoft Office\</Image>
    <Image condition="contains">C:\Program Files (x86)\Microsoft Office\</Image>
	<Image condition="contains">C:\Program Files\Intel\</Image>
    <Image condition="contains">C:\Program Files (x86)\Intel\</Image>
	<Image condition="contains">C:\Program Files\Microsoft.NET\Framework\</Image>
    <Image condition="contains">C:\Program Files (x86)\Microsoft.NET\Framework\</Image>
	<Image condition="contains">C:\Program Files (x86)\HP\</Image>
	<Image condition="contains">C:\Program Files\HP\</Image>
	<Image condition="contains">C:\Program Files\Dropbox\Client\Dropbox.exe</Image>
	<Image condition="contains">C:\Program Files (x86)\Common Files\Adobe\</Image>
	<Image condition="contains">C:\Program Files (x86)\Common Files\Apple\</Image>
<!-- Source and destination Ports-->
	<DestinationPortName condition="end with">netbios-ns</DestinationPortName>
	<DestinationPortName condition="end with">netbios-ns</DestinationPortName>
	<DestinationPort condition="is">49159</DestinationPort>
	<DestinationPort condition="is">49156</DestinationPort>
	<SourcePortName condition="end with">llmnr</SourcePortName>

	</NetworkConnect>
When creating a sysmon configuration keep in mind the following Syntax regarding condition=
| Condition | Description |
|---|---|
| Is | Default, values are equals |
| is not | Values are different |
| Contains | The field contains this value |
| Excludes | The field does not contain this value |
| begin with | The field begins with this value |
| end with | The field ends with this value |
| less than | Lexicographical comparison is less than zero |
| more than | Lexicographical comparison is more than zero |
I will break down the configuration shown above:
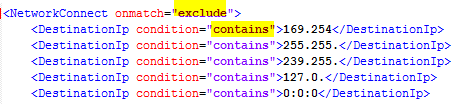
<NetworkConnect onmatch=”exclude”> means that Sysmon will exclude conditions that match certain criteria that we will provide. If you change this to “include”, then Sysmon will only log those specific conditions. In this particular configuration we are also excluding any Microsoft default addresses, broadcast addresses and localhost addresses as we are not interested in them. You can always start without filtering them and see if you get any value from them.
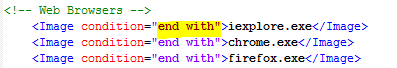
End With allows you to enter any file name executable and match any file path ending with that particular file. In the example above, any file path such as C:\Program Files (x86)\Google\Chrome\Application\chrome.exe or c:\users\appdata\Google\Chrome\chrome.exe will both be excluded. (Note: that malware ending with “chrome.exe” would also be excluded so be careful).

“is” will look for a specific path, for example c:\Program Files\Malwarebytes Anti-Malware\mba.exe
While Contains will look for anything matching a particular set of words such as c:\Program Files\Malwarebytes Anti-Malware\ will include any other executable under this folder.
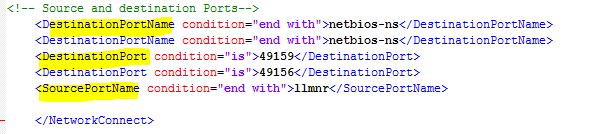
Sysmon Event ID 3 will also generate other fields within that particular event. You may also filter on these as some of these connections might be expected and perhaps we don’t want them overwhelming our logging server. These fieldnames include DestinationPortName, DestinatinonPort, and SourcePortName.
As you continue adding exclusions to your Sysmon configuration file, you will notice a decrease in the events being logged in your event viewer; however, you will also come across those applications that are not so easy to exclude.
I would be very careful on not overusing the “end with” syntax as Malware will often be named that way to hide in plain sight. Instead, spend some time figuring out the paths for these applications. A challenge you will face are those GoTomeeting, Dropbox, or any other applications that run from the c:\users\appdata\ folder, specially those with random numbers, other patterns (e.g. C:\Users\pdelgado~1\AppData\Local\Temp\6492_1316\software_reporter_tool.exe) which will not be feasible to filter out with Sysmon; however, this is where we may leverage Logstash to do so.
Logstash:
As mentioned earlier, at this time we have filtered out most of our noise using Sysmon and have been very specific about the items that we don’t want to see, which are those expected connections from our endpoints. Logstash will be focused on filtering out those executables that appear under appdata folder or any other place not suitable for Sysmon filtering.
Use Cases:
- Legitimate OS processes will make internal and outbound connections such as svchost.exe, dns.exe, System. I want to be able to filter out the internal noise and see what kind of external IPs those are communicating with.
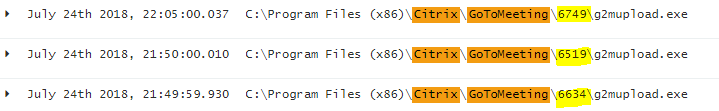
- Filter out application such as Gotomeeting (g2mupdate.exe), GoogleUpdate.exe, that might be located under appdata, or might have different folder number schemes such as the following image:
 Or more complicated ones like: C:\Users\pdelgado~1\AppData\Local\Temp\8FFA79F7-BBCD-4D73-903C-B8A82FC482B0\G2MInstaller.exe
 - Sysmon will often log file paths slightly different, some are UPPERCASE, others are a combination of lower-case letters, here’s an example:
C:\Windows\System32\LogonUI.exe C:\Windows\SysWOW64\LogonUI.exe C:\WINDOWS\system32\LogonUI.exe C:\Windows\system32\LogonUI.exe C:\windows\system32\LogonUI.exe
Solving These Use Cases:
Use Case 1: Filtering legitimate OS processes
Read this article to ensure you setup the Logstash CIDR Plug-in and then you can use the configuration shown below.
####################################### Sysmon Network Logs ###################################


# Makes a new field based on outbound communications to the inside.
filter {
  if "winlogbeat" in [tags] and [log_name] == "Microsoft-Windows-Sysmon/Operational" and [event_id] == 3 {
cidr {
    add_field => { "IPDestination" => "Private" }
    address => [ "%{[event_data][DestinationIp]}" ]
    network => [ "192.168.0.0/16", "10.0.0.0/8", "172.16.0.0/12"]
  }
}
}
It’s important to understand that the Logstash configuration is read in a top-down approach; therefore, we’re adding this filter at the beginning of the configuration. As new events come through the parser, and if those IP addresses are Private addresses, then a “Private” field will be created.
This will ensure that all Private Connections (RFC 1918) are labeled as “Private” to ensure that we can filter out these connections when looking at dns.exe, svchost.exe, etc.. these events are very, very chatty; therefore, it’s important to at least label them and be able to filter them out when searching in Kibana.
Below are some examples of how such filtering can happen. Here I’m dropping all these events which might not be useful to me. You don’t have to drop them as you can just filter out these Private events within Kibana (I will show this later).
#Drops Internal DNS requests and IIS Worker Process
filter {
  if "winlogbeat" in [tags] and [event_id] == 3
and ([event_data][Image] == "C:\Windows\System32\dns.exe"
or [event_data][Image] == "C:\Windows\SysWOW64\inetsrv\w3wp.exe")
and [IPDestination] == "Private"  {
drop { }
}
}


#Drops Excessive lsass.exe

filter {
  if "winlogbeat" in [tags] and [event_id] == 3 and [event_data][Image] == "C:\Windows\System32\lsass.exe" and ([event_data][DestinationPort] == "88"
  or [event_data][SourcePort] == "88"
  or [event_data][SourcePort] == "389"
  or [event_data][DestinationIp] == "192.x.x.x.")
  and [IPDestination] == "Private" {
  drop { }
}
}


#Drops Destination Port 445 from expected Systems

filter {
  if "winlogbeat" in [tags] and [event_id] == 3 and [event_data][Image] == "System" and ([event_data][DestinationPort] == "445"
  and ([computer_name] == "Windowsmachinegoeshere"
  or [computer_name] == "Windowmachinegoeshere2)){
  drop { }
}
}
Use Case # 2: As mentioned before Sysmon lacks advanced filtering (so far); Therefore, to tackle this challenge, we’ll leverage the Logstash Grok Patterns. The first thing I do is get a list of all applications making network connections (event ID 3), then find the ones that can be filtered via Logstash. The example below is Gotomeeting which has a folder # that might complicate things. For this particular scenario we can leverage Regex (from regex101.com which is a great resource)

Other examples:
Sample Path 1: C:\Users\PDELGADO~1\AppData\Local\Temp\8FFA79F7-BBCD-4D73-903C-B8A82FC482B0\G2MInstaller.exe
Regex Match: \\AppData\\Local\\Temp\\[a-zA-Z0-9]{0,8}-[a-zA-Z0-9]{0,4}-[a-zA-Z0-9]{0,4}-[a-zA-Z0-9]{0,4}-[a-zA-Z0-9]{0,12}\\G2MInstaller.exe
Sample Path 2: C:\Windows\SysWOW64\Macromed\Temp\{CE4BD592-D1BB-4C22-9428-FF632509F73F}\InstallFlashPlayer.exe
Regex Match: ^[a-zA-Z]:\\Windows\\SysWOW64\\Macromed\\Temp\\{[a-zA-Z0-9]{0,8}-[a-zA-Z0-9]{0,4}-[a-zA-Z0-9]{0,4}-[a-zA-Z0-9]{0,4}-[a-zA-Z0-9]{0,12}}\\InstallFlashPlayer.exe
Sample Path 3: C:\ProgramData\Microsoft\Windows Defender\Platform\4.18.1806.18062-0\MsMpEng.exe
Regex Match: ^[a-zA-Z]:(\\[^\:\\]+)\\Microsoft\\Windows Defender\\[a-z-A-Z]latform\\[a-zA-Z0-9]{0,8}.[a-zA-Z0-9]{0,8}.[a-zA-Z0-9]{0,8}.[a-zA-Z0-9]{0,8}-[a-zA-Z0-9]{0,8}\\MsMpEng.exe
You get the idea, this provides a good amount of flexibility to ensure we’re filtering only what we know is expected or not critical to a future investigation.
Use case #3: As mentioned earlier, some of your logs will have UPPERCASE and some might be lowercase; therefore, it’s going to take you some time to be able to cover most common of these varieties.
Note: Initially you might need to add these in your Sysmon config as we know that certain processes will be very chatty; therefore, I’d rather add some of these at the Sysmon configuration before they reach Logstash for parsing.
Here’s an example for cmd.exe (Note: please don’t add this example to your exclusion as malware often uses this path)
Image 1 = C:\Windows\system32\cmd.exe
Image 2 = c:\Windows\system32\Cmd.exe
Image 3 = C:\WINDOWS\System32\cmd.exe
Image 4 = C:\Windows\System32\cmd.exe
For this example, I would add the following Logstash Regex filter:
^[a-zA-Z]:(\\[^\:\\]+)\\[a-z-A-Z]ystem32\\[a-z-A-Z]md.exe
One simple Regex pattern that will take care of this inconvenience.
Logstash Configuration
Now that we’ve covered most of Sysmon & Logstash parsing, here’s a sample Logstash configuration to get you started with.
####################################### Sysmon Network Logs ###################################


# Makes a new field based on outbound communications to the inside.
filter {
  if "winlogbeat" in [tags] and [log_name] == "Microsoft-Windows-Sysmon/Operational" and [event_id] == 3 {
cidr {
    add_field => { "IPDestination" => "Private" }
    address => [ "%{[event_data][DestinationIp]}" ]
    network => [ "192.168.0.0/16", "10.0.0.0/8", "172.16.0.0/12"]
  }
}
}

#Drops Internal DNS requests and IIS Worker Process
filter {
  if "winlogbeat" in [tags] and [event_id] == 3
and ([event_data][Image] == "C:\Windows\System32\dns.exe"
or [event_data][Image] == "C:\Windows\SysWOW64\inetsrv\w3wp.exe")
and [IPDestination] == "Private"  {
drop { }
}
}


#Filters out Internal Java connections

filter {
  if "winlogbeat" in [tags] and [event_id] == 3
  and ([event_data][Image] =~ /^[a-zA-Z]:(\\[^\:\\]+)\\Java\\jre[0-9].[0-9].[0-9]_[0-9][0-9][0-9]\\bin\\jp2launcher.exe/
  or [event_data][Image] =~ /^[a-zA-Z]:(\\[^\:\\]+)\\Java\\jdk\d+(\.\d+\.\d_+\d+)\\bin\\java.exe/
  or [event_data][Image] =~ /^[a-zA-Z]:(\\[^\:\\]+)\\Java\\jre7\\bin/
  or [event_data][Image] =~ /^[a-zA-Z]:(\\[^\:\\]+)\\JRE\\bin/
  or [event_data][Image] =~ /^[a-zA-Z]:(\\[^\:\\]+)\\TDI\\jvm\\jre\\bin/
  or [event_data][Image] =~ /^[a-zA-Z]:\\Java\\jdk[0-9].[0-9].[0-9]_[0-9][0-9]\\bin\\java.exe/)
  and [IPDestination] == "Private" {
drop { }
}
}

#Drops Sysmon Events - NetworkConnect  event ID 3

filter {
  if "winlogbeat" in [tags] and [event_id] == 3
  and ([event_data][Image] =~ /^[a-zA-Z]:(\\[^\:\\]+)\\Adobe/
  or [event_data][Image] =~ /^[a-zA-Z]:(\\[^\:\\]+)\\[a-zA-Z]ys[a-zA-Z][a-zA-Z]W64\\Macromed\\Flash/
  or [event_data][Image] =~ /^[a-zA-Z]:(\\[^\:\\]+)\\[a-z-A-Z]ystem32\\Macromed\\Flash/
  or [event_data][Image] =~ /^[a-zA-Z]:\\HP_/
  or [event_data][Image] =~ /^[a-zA-Z]:(\\[^\:\\]+)\\NVIDIA Corporation/
  or [event_data][Image] =~ /^[a-zA-Z]:(\\[^\:\\]+)\\Microsoft Visual Studio/
  or [event_data][Image] =~ /^[a-zA-Z]:(\\[^\:\\]+)\\McAfee/
  or [event_data][Image] =~ /^[a-zA-Z]:(\\[^\:\\]+)\\Dropbox/
  or [event_data][Image] =~ /^[a-zA-Z]:(\\[^\:\\]+)\\Common Files\\Adobe/
  or [event_data][Image] =~ /^[a-zA-Z]:(\\[^\:\\]+)\\Microsoft Office/
  or [event_data][Image] =~ /^[a-zA-Z]:(\\[^\:\\]+)\\Intel/
  or [event_data][Image] =~ /^[a-zA-Z]:(\\[^\:\\]+)\\Microsoft.NET\\Framework/
  or [event_data][Image] =~ /^[a-zA-Z]:(\\[^\:\\]+)\\[A-Za-z]enovo/
  or [event_data][Image] =~ /^[a-zA-Z]:(\\[^\:\\]+)\\Common Files\\Java\\Java Update/
  or [event_data][Image] =~ /^[a-zA-Z]:(\\[^\:\\]+)\\[a-zA-Z]eb[a-zA-Z]x/    #takes care of WebEx and webex
  or [event_data][Image] =~ /^[a-zA-Z]:(\\[^\:\\]+)\\Citrix/
  or [event_data][Image] =~ /^[a-zA-Z]:(\\[^\:\\]+)\\Spiceworks/
  or [event_data][Image] =~ /\\AppData\\Local\\GoToMeeting\\\d{4}/
  or [event_data][Image] =~ /\\AppData\\Local\\Citrix\\GoToMeeting\\\d{4}\\g2mupdate.exe/
  or [event_data][Image] =~ /\\AppData\\Local\\GoToMeeting\\\d{4}\\g2mupdate.exe/
  or [event_data][Image] =~ /\\AppData\\Local\\Citrix\\GoToMeeting\\\d{4}/
  or [event_data][Image] =~ /\\AppData\\Local\\Google\\Update\\GoogleUpdate.exe/
  or [event_data][Image] =~ /^[a-zA-Z]:(\\[^\:\\]+)\\GoToMeeting\\\d{4}/
  or [event_data][Image] =~ /^[a-zA-Z]:(\\[^\:\\]+)\\Citrix\\GoToMeeting\\\d{4}/
  or [event_data][Image] =~ /\\AppData\\Local\\Citrix/  ){
    drop { }
  }
}
As mentioned earlier, if you are planning on doing any filtering based on “Private” addresses, ensure that the CIDR filter is included before those filter rules as logstash reads the configuration from the top-bottom.
To install the CIDR plug-in for logstash read this article to get a better understanding; otherwise just run the following to install
cd /usr/share/logstash/
bin/logstash-plugin install logstash-filter-cidr
you should see a “Installation successful” message if it was downloaded successfully.
Final Notes
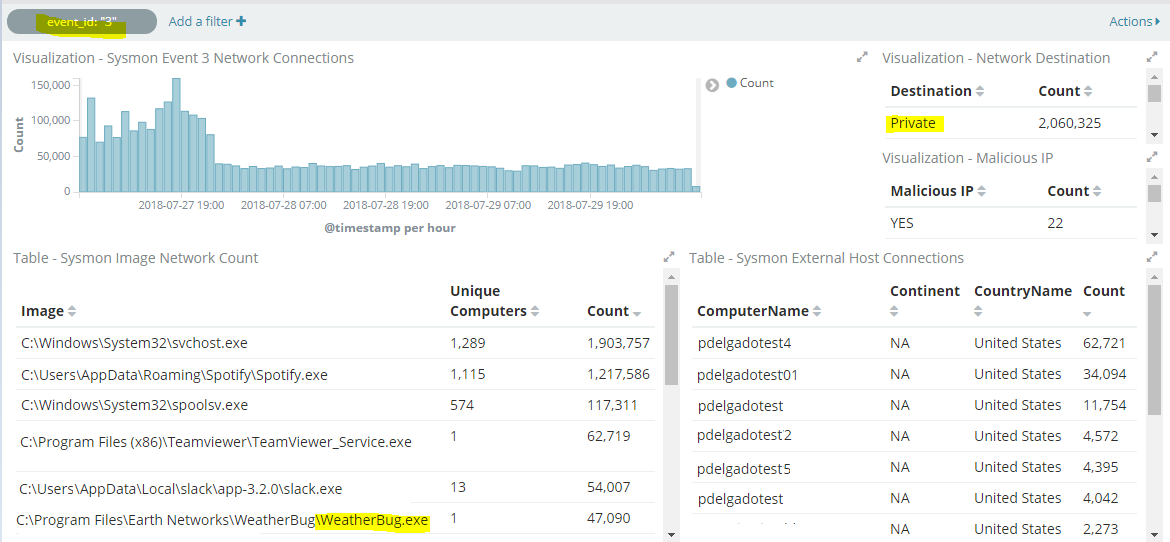
I’d suggest that you make a Dashboard in Kibana to visualize all of your incoming connections and then start filtering based on the number of logs. Here’s an example of one of my dashboards which shows all executables that are generating a network connection. As you can see I also have other fields such as “Private” which I can easily exclude from my searches.
Throughout the article I’ve been mentioning “filtering out”. In the configuration I provided above, the drop { } Logstash filter, will ignore these logs and they will never be written to Elasticsearch. If your organization needs to collect all logs, whether relevant to an investigation or not, I’d suggest you add them to an “expected connections” field or something similar. This way you still have all logs you want; however, you can exclude them from the search itself:
Using an earlier example:
Drop Example:
#Drops Internal DNS requests and IIS Worker Process
filter {
  if "winlogbeat" in [tags] and [event_id] == 3
and ([event_data][Image] == "C:\Windows\System32\dns.exe"
or [event_data][Image] == "C:\Windows\SysWOW64\inetsrv\w3wp.exe")
and [IPDestination] == "Private"  {
drop { }
}
}
Mutate or adding an additional field called “short_message” example:
#Adds "expected field" to Internal DNS requests and IIS Worker Process
filter {
  if "winlogbeat" in [tags] and [event_id] == 3
and ([event_data][Image] == "C:\Windows\System32\dns.exe"
or [event_data][Image] == "C:\Windows\SysWOW64\inetsrv\w3wp.exe")
and [IPDestination] == "Private"  {
mutate {
   add_field => { "short_message" => "Expected Internal Connection" }
  }
}
If disk space isn’t an issue, this should be a feasible solution.
Conclusion
To recap, I would suggest for you to do the following:
- Deploy the Windows Event Forwarder
- Deploy Sysmon to a few systems first via GPO (The logs may be overwhelming so limit to a few systems first while you perfect your configuration).
- Setup ELK – Here’s my instructions for versions 5.x; however, there’s other tutorials online for 6.x for Windows.
- Send those Windows/Sysmon logs to ELK
- Create meaningful visualizations in Kibana to see the specific logs being sent and based on this, modify your Sysmon configuration first.
- For complex file paths, use Logstash to perform further filtering.
- Extend the installation of Sysmon to all of your endpoints to find new executables to be filtered.
- Threat Hunt! Look at well-documented connections and make meaningful queries in Kibana to find relevant information, here’s a sample search query to look at Destination ports 443, 80, 25, 53, 22, 135, 3389 that might potentially show us malware making outbound connections:
event_data.DestinationPort: (443 OR 80 OR 25 OR 53 OR 22 OR 135 OR 3389)
It’s important to note that this process will take weeks or months to perfect as you will need data to know what’s the “norm”. Don’t just start filtering things out as you might make mistakes, for example it’s easy to exclude noisy processes such as svchost.exe, or system via Sysmon; however, those processes are often used by malware and if you filter them out, you’ll have a blind spot which will be difficult to detect.
Take your time and really do understand what’s considered normal to your organization. I can promise you that once you have taken your time to perfect your configuration, you will find the nefarious processes your are looking for, or at least you’ll know which of your users have Spotify or Weatherbug installed 😉
Final Notes:
I understand it’s much easier to use a configuration such as SwiftOnSecurity’s sysmon config to get started; however, I would take the approach of casting a “wide net” and then tailoring that particular configuration to your own organization. This not only provides meaningful information to your Security Analysts, but you will also find other interesting information that might shed light to “misconfigured” endpoint software that your Sysadmins might appreciate, or at least give you a full picture of what is running on your endpoints.
Thanks for reading!
Hi
I want to build threat hunting platform, but i want it to be placed on cloud. Do you thing its practical? Especially with the amount of logs.
Depends on the provider and amount of logs. I’d recommend testing locally and tuning your configurations to where you’re only capturing relevant logs that might help you with threat hunting.