Whether your environment was compromised and someone got a hold of your Domain Admin account, or you’re just ensuring that domain admins are logging in to expected systems. It is important to track the actions of these accounts as they tend to have full rights to most Windows domain-joined systems.
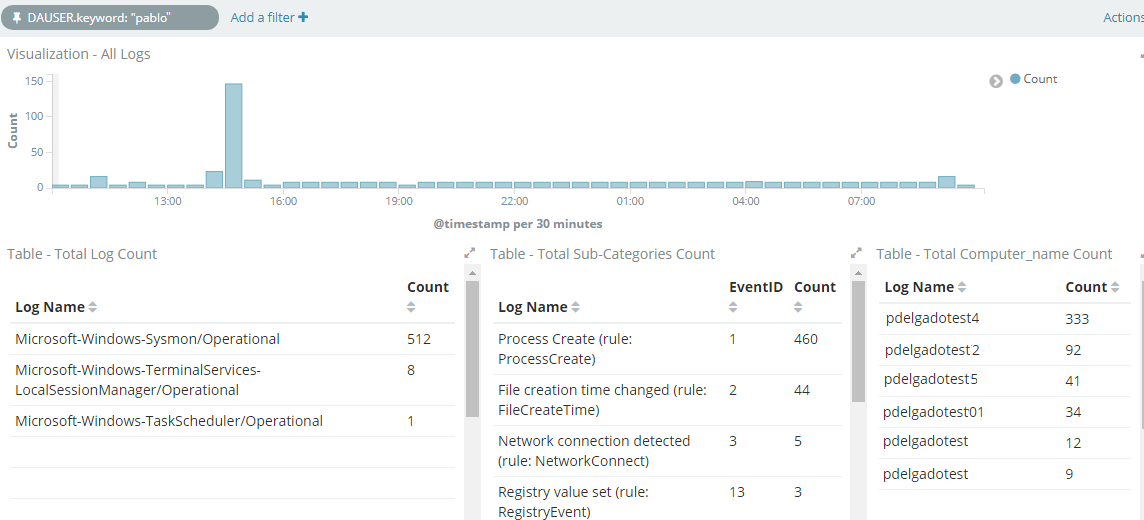
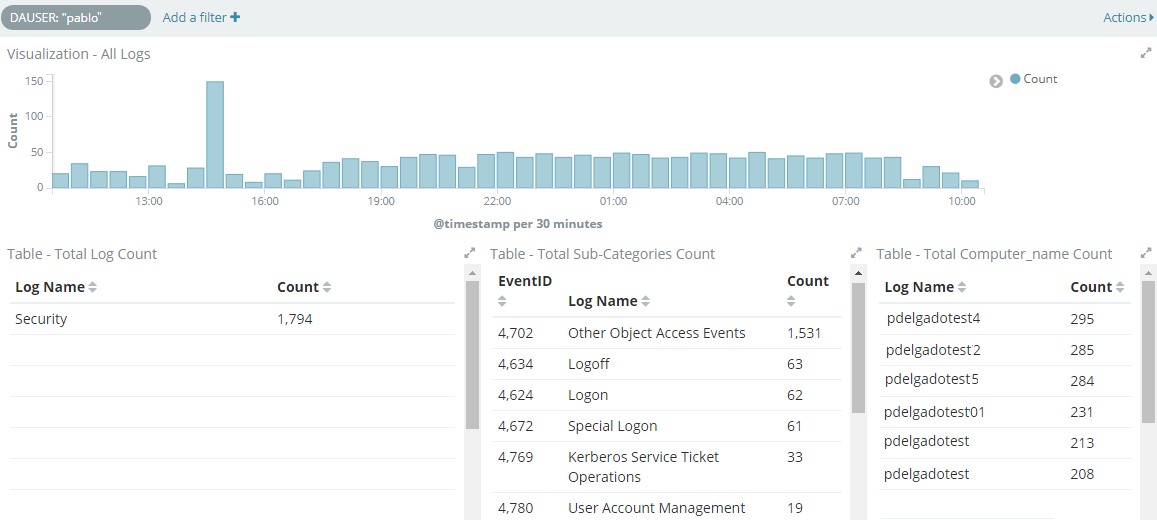
Our end result should be a dashboard that shows all-related activities performed by Domain Admin user(s).
We will leverage Logstash’s Grok Patterns to create a “pattern” file in which we will list our Domain Admin accounts and then compare it to any incoming event generated by our Windows endpoints. This should allow us to associate any kind of action that contains that particular Domain Account username and quickly investigate any pertaining events.
Getting Started
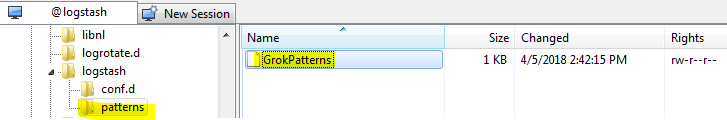
- We will get started by creating a simple plain-text document under /etc/logstash/patterns and call it “GrokPatterns” (Or whatever preferred name you’d like)
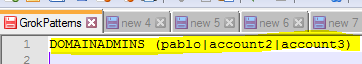
within the document, we will add the following along with the list of the domain admin accounts.
DOMAINADMINS (pablo|account2|account3)
There is a space after DOMAINADMINS and each account is separated by a pipe symbol “|”.
Your document should look like the following:
Save it, and now let’s go back to your Logstash config.
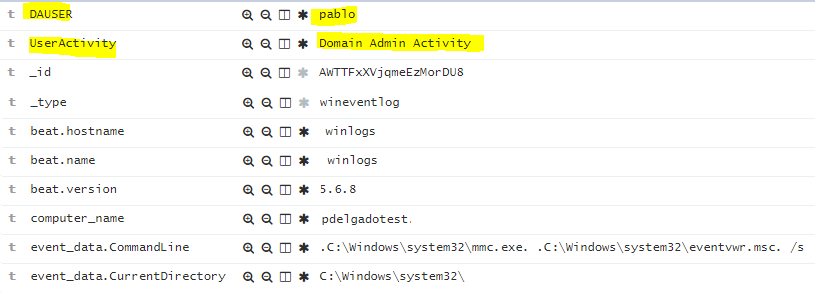
2. Within Logstash, we will add a filter that will compare any incoming Winlogbeat message events, and if they match a username within our GrokPatterns file, it will create two fields in Elasticsearch.
- DAUSER – Dynamic field with matching username
- UserActivity: Domain Admin Activity (Static field)
messages will look like the image below in Elasticsearch/Kibana.
Here’s the Logstash configuration.
# Matches Domain Administrator activity for all logs
filter {
  if "winlogbeat" in [tags] {
    grok {
      patterns_dir => [ "/etc/logstash/patterns" ]
      match => { "message" => "%{DOMAINADMINS:DAUSER}" }
      add_field => { "UserActivity" => "Domain Admin Activity" }
    }
  }
}
As simple as that. Don’t forget to restart your Logstash service to ensure the new configuration applies.
Wrapping up
I have this configuration for all Windows Event logs, in addition to Security events which can also show us where these Domain Admins are logging in to as show in the following image:
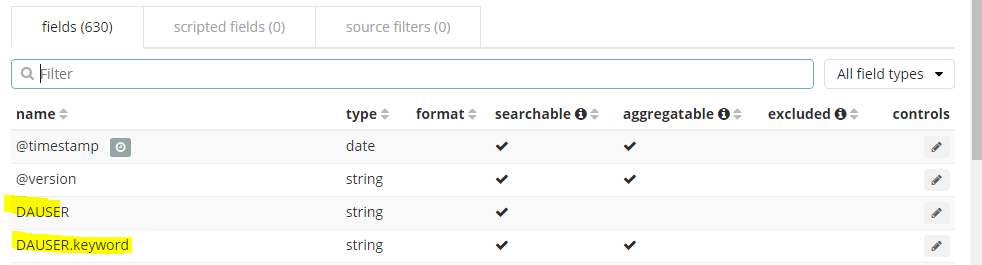
Create your own favorite Dashboard and ensure that you refresh your index in Kibana as your new fields will not be Index until you manually do so.
To do this in Kibana 5.x, navigate to
Management > Index Pattern > Click on the refresh button

Then your fields should appear and you may be able to search for them.
Conclusion
As mentioned earlier, it’s important to track actions performed by your Domain Administrators as you might not want someone logging in to an accounting or finance server just because they can. This can also bring awareness of future access controls that can be implemented to prevent these actions by privileged users.
Thanks for reading!