Accountability is important, and sometimes we might need to investigate who made certain changes at a specific time, or ensure that our privileged accounts are not logging in to other sensitive systems.
Many organizations might use 3rd party utilities for Help Desk to remotely assist their end-users. One of these applications is VNC, which will create event ID 256 for various actions under the Application event viewer. The Information for an authenticated connection will be Connections: authenticated:IP address::port, as user (permissions) as seen in the image below:
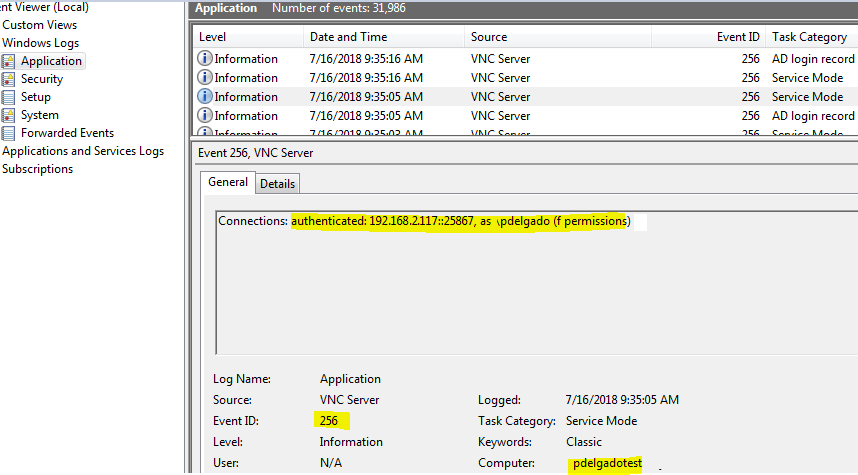
Although we can collect this event with no problem, we don’t get the source username or ip address in an extracted field which makes it difficult to search and create dashboards. To solve this, we can write a simple GROK pattern for Logstash to ensure we extract the fields that we’re interested in.
This is a grok pattern for Logstash in which we look at event ID 256, specifically for VNC Server (5.x, 6.x) to capture the following:
################################## VNC ######################################

filter {
 if "winlogbeat" in [tags] and [source_name] == "VNC Server" and [event_id] == 256 {
 grok {
 match => { "message" => "%{DATA:connection}:\s%{DATA:Action}:\s%{IPV4:SourceIP}::%{DATA:Port},\sas\s%{DATA:Signed_as}\s" }
 }
 }
}
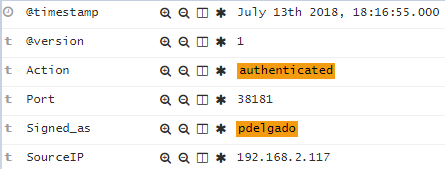
This will ensure that we have meaningful and searchable fields in Elasticsearch as shown next:
Now we can create some authentication dashboards with these fields:
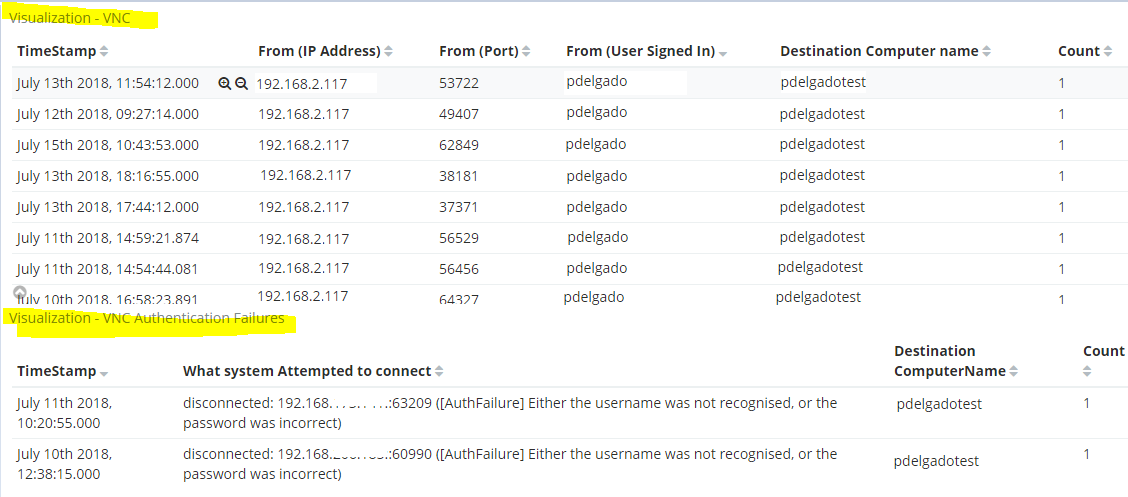
Fields used to create these visualizations:
SourceIP.keyword
Port.keyword
Signed_as.keyword
computer_name.keyword
RDP – Remote Desktop Protocol
Plenty of people use The Remote Desktop Connection utility to connect other systems, whether it’s users connecting from home, or Sysadmins to jump into another box, we all use remote desktop. There’s been many instances where I had to see who logged in to what system at a particular day, let’s go ahead and ensure we can accomplish this task.
Prerequisites:
Ensure that you are collecting the following event IDs from the following source: Microsoft-Windows-TerminalServices-LocalSessionManager/Operational
EventID: 21 – Session Logon Succeeded
EventID: 24 – Session has been disconnected
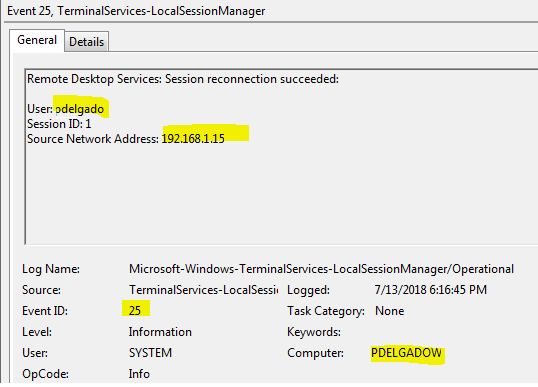
EventID: 25 – Session Reconnection Succeeded
For other RDP-Related Event IDs, Read Jonathon Poling’s blog on this specific topic which is goes in a much more in-depth explanation.
Just as our VNC example earlier, Windows generates this event ID all under the message field. The only information it doesn’t extract is the Action taken such as (Session Re-connection succeeded, disconnected, etc.)
To solve this, once again we rely on the Logstash Grok pattern to extract the action description (This step is optional, but I don’t like memorizing Event IDs (21,24,25). This will add a new field called “EventDescription” with the action name.
################################## Remote Desktop ######################################

filter {
   if "winlogbeat" in [tags] and [log_name] == "Microsoft-Windows-TerminalServices-LocalSessionManager/Operational" and [event_id] == 21 {
  mutate {
    add_field => { "EventDescription" => "Session logon succeeded" }
  }
}
}

filter {
   if "winlogbeat" in [tags] and [log_name] == "Microsoft-Windows-TerminalServices-LocalSessionManager/Operational" and [event_id] == 24 {
  mutate {
    add_field => { "EventDescription" => "Session has been disconnected" }
  }
}
}

filter {
   if "winlogbeat" in [tags] and [log_name] == "Microsoft-Windows-TerminalServices-LocalSessionManager/Operational" and [event_id] == 25 {
  mutate {
    add_field => { "EventDescription" => "Session reconnection succeeded" }
  }
}
}
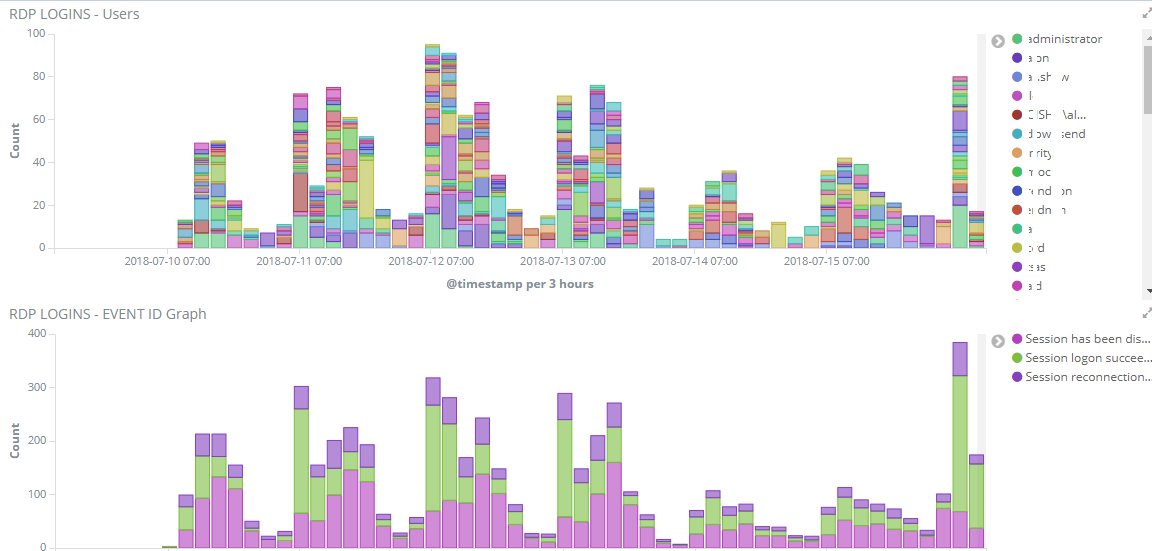
Finally, we can make some meaningful Visualizations and add them to our RDP dashboards.
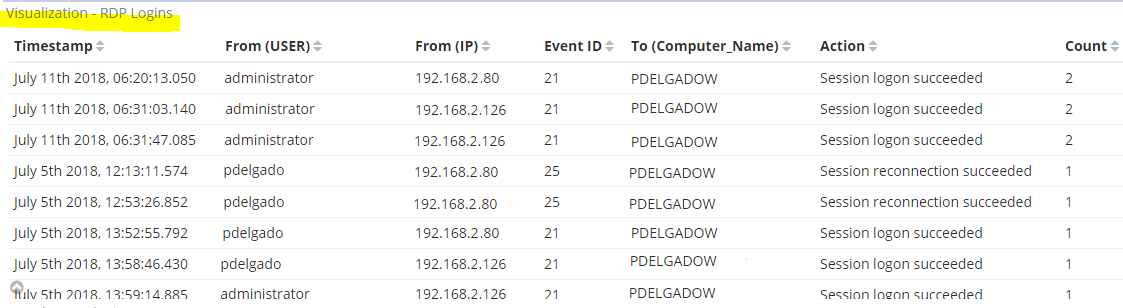
Fields Used:
user_data.User.keyword
user_data.Address.keyword
event_id
computer_name.keyword
EventDescription.keyword
Other ideas for dashboards:
Additionally if you are collecting Sysmon logs and Windows Security Logs, you can also look at connections via port 3389 and obtain the same type of information, you might have to look at events 4624 (Successful login), 4625 (Failed login) to make this information meaningful to you.
Thanks for reading.