Two articles ago I covered how to monitor Active Directory using ELK. Now you should be seeing account login information (successful logins, failed logins, lockouts, etc.). However; When looking at account authentications coming from the VPN concentrator, it’s difficult to tell where those logins are really coming from as the source ip will be that of the VPN concentrator internal ip.
I wanted to know exactly where these VPN connections are initiating from and later be able to analyze any unexpected connections (unexpected geographical locations), along with troubleshooting any failed authentications from remote users.
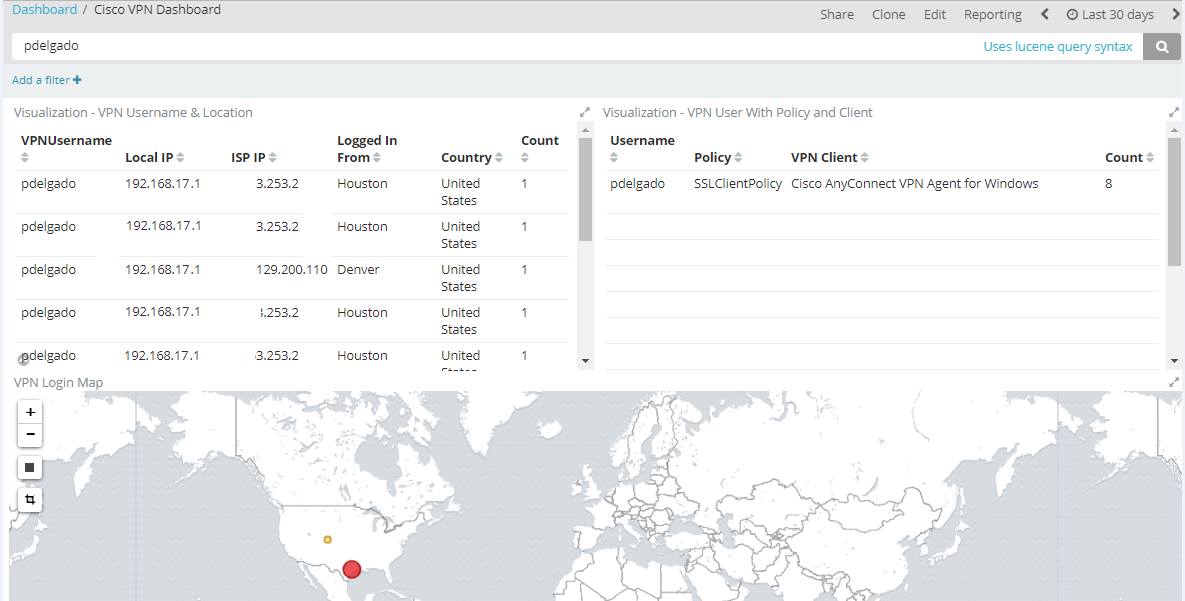
Here’s a screenshot of the final result:
Getting started
I wanted to create a dashboard where I can incorporate both my AD logins and also add the Cisco VPN concentrator logs in the same view.
The first step is to create a Logstash configuration for your Cisco ASA to ensure that your logs are being parsed correctly. I am using Jack Hanington’s configuration as it works well with my environment. In addition I added my own grok parsing for specific Cisco Events such as ASA-4-722051, ASA-6-722055, ASA-6-113005.
- ASA-4-722051 – Provides originating ISP source IP, user, and the internal (rfc 1918) ip address.
- ASA-6-722055 – Provides originating ISP source IP, the user, and the Cisco agent being used to establish the connection
- ASA-6-113005 – Provides authentication rejection information, used for troubleshooting failed authentications.
These are the only events that I’m currently concerned about to understand where a user is coming from, what internal ip they are being assigned, what software they are using to connect to my environment, and any account failure messages. There are tons of other events that you may incorporate if you’d like.
Configuration
The configuration will have two ouputs.
- First output will be writing to the same index as your Active Directory ELK logs. I’ve ensured that the fields created, match those of a Winlogbeat field so it makes it easier when searching for the logs.
- Second output is for your Cisco ELK server which will be very noisy (ensure you have enough disk space), or drop the logs if you don’t need them.
Here is the configuration file:
input {
 udp {
 port => 5000
 type => "cisco-fw"
 }
}

filter {
 ####### Cisco FW ####
 if [type] == "cisco-fw" {
 grok {
 match => ["message", "%{CISCO_TAGGED_SYSLOG} %{GREEDYDATA:cisco_message}"]
 }
 # Parse the syslog severity and facility
 syslog_pri { }


 grok {
 match => [
 "cisco_message", "%{CISCOFW106001}",
 "cisco_message", "%{CISCOFW106006_106007_106010}",
 "cisco_message", "%{CISCOFW106014}",
 "cisco_message", "%{CISCOFW106015}",
 "cisco_message", "%{CISCOFW106021}",
 "cisco_message", "%{CISCOFW106023}",
 "cisco_message", "%{CISCOFW106100}",
 "cisco_message", "%{CISCOFW110002}",
 "cisco_message", "%{CISCOFW302010}",
 "cisco_message", "%{CISCOFW302013_302014_302015_302016}",
 "cisco_message", "%{CISCOFW302020_302021}",
 "cisco_message", "%{CISCOFW305011}",
 "cisco_message", "%{CISCOFW313001_313004_313008}",
 "cisco_message", "%{CISCOFW313005}",
 "cisco_message", "%{CISCOFW402117}",
 "cisco_message", "%{CISCOFW402119}",
 "cisco_message", "%{CISCOFW419001}",
 "cisco_message", "%{CISCOFW419002}",
 "cisco_message", "%{CISCOFW500004}",
 "cisco_message", "%{CISCOFW602303_602304}",
 "cisco_message", "%{CISCOFW710001_710002_710003_710005_710006}",
 "cisco_message", "%{CISCOFW713172}",
 "cisco_message", "%{CISCOFW733100}"
 ]
 }

 #If CiscoTag is ASA-4-722051
 if [type] == "cisco-fw" and [ciscotag] == "ASA-4-722051" {
 grok {
 match => ["cisco_message", "%{DATA:Group}\s<%{DATA:Policy}> User\s<%{DATA:[event_data][TargetUserName]}> IP\s<%{IPV4:src_ip}> IPv4 Address <%{IPV4:assigned_ip}%{GREEDYDATA:extra_field}"]
 }
}

  #If CiscoTag is ASA-6-722055
 if [type] == "cisco-fw" and [ciscotag] == "ASA-6-722055" {
 grok {
 match => ["cisco_message", "%{DATA:Group}\s<%{DATA:Policy}> User\s<%{DATA:[event_data][TargetUserName]}> IP\s<%{IPV4:src_ip}> Client Type:%{GREEDYDATA:VPN_Client}"]
 }
}

 #If CiscoTag is ASA-6-722055 - Authentication Rejected
 if [type] == "cisco-fw" and [ciscotag] == "ASA-6-113005" {
 grok {
 match => ["cisco_message", "%{DATA:Group}\s%{GREEDYDATA:Policy} : reason =\s%{DATA:Reason} : server =\s%{IPV4:ServerIP} : user =\s%{DATA:[event_data][TargetUserName]} : user IP =\s%{IPV4:src_ip}"]
 }
}


if [type] == "cisco-fw" {
 geoip {
 add_tag => [ "GeoIP" ]
 database => "/etc/logstash/GeoLite2-City.mmdb" ### Change me to location of GeoLiteCity.dat file
 source => "src_ip"
 }

 if [geoip][city_name] == "" { mutate { remove_field => "[geoip][city_name]" } }
 if [geoip][continent_code] == "" { mutate { remove_field => "[geoip][continent_code]" } }
 if [geoip][country_code2] == "" { mutate { remove_field => "[geoip][country_code2]" } }
 if [geoip][country_code3] == "" { mutate { remove_field => "[geoip][country_code3]" } }
 if [geoip][country_name] == "" { mutate { remove_field => "[geoip][country_name]" } }
 if [geoip][latitude] == "" { mutate { remove_field => "[geoip][latitude]" } }
 if [geoip][longitude] == "" { mutate { remove_field => "[geoip][longitude]" } }
 if [geoip][postal_code] == "" { mutate { remove_field => "[geoip][postal_code]" } }
 if [geoip][region_name] == "" { mutate { remove_field => "[geoip][region_name]" } }
 if [geoip][time_zone] == "" { mutate { remove_field => "[geoip][time_zone]" } }
 }


 # Parse the date
 date {
 match => ["timestamp",
 "MMM dd HH:mm:ss",
 "MMM d HH:mm:ss",
 "MMM dd yyyy HH:mm:ss",
 "MMM d yyyy HH:mm:ss"
 ]
 }
 }
 ###### End of Cisco FW #######
}


output {
if [type] == "cisco-fw" and ([ciscotag] == "ASA-4-722051" or [ciscotag] == "ASA-6-722055" or [ciscotag] == "ASA-6-113005") {
    elasticsearch {
    hosts => ["http://ActiveDirectoryELK:9200"]
	index => "logstash-ciscovpn-%{+xxxx.ww}"

  }
 }
#	old index format: index => "logstash-winlogbeat-%{+YYYY.MM.dd}"
else if [type] == "cisco-fw" {
 elasticsearch {
    hosts => ["http://CiscoELK:9200"]
	index => "logstash-cisco-%{+xxxx.ww}"

  }
}

}
(don’t forget to setup your Cisco ASA to send logs via Syslog for your Logstash on the port specified by your configuration, in this example Port 5000)
Remember that the VPN logs that we’re interested in will be written to your AD ELK server, so go through the normal process of creating an index, and then create your own dashboards.
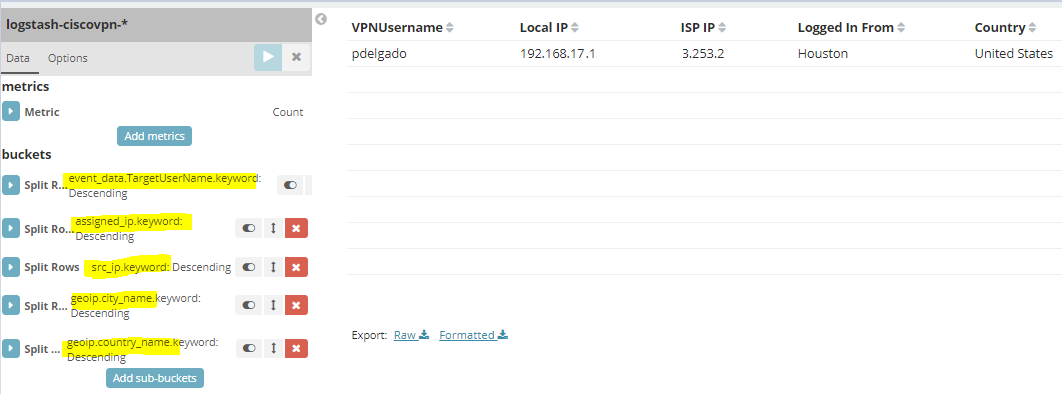
Here’s the visualizations created for my dashboard along with the field names:
Successful logins:
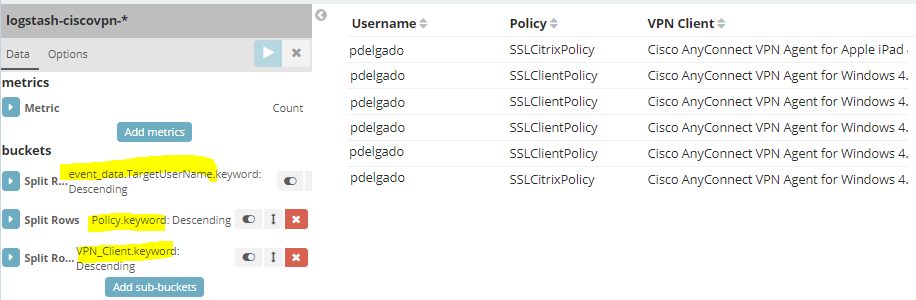
VPN Client Information:
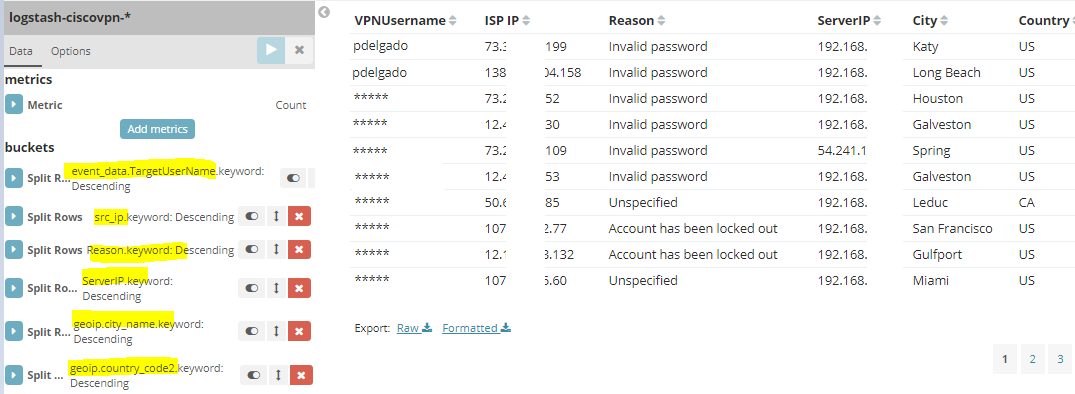
Failed Login Attempts:
Add these visualizations to your existing Active Directory dashboard in Kibana and you may now search across for a username to ensure that you are seeing all related logins from both your Active Directory and VPN concentrator.
Conclusion
As mentioned, this has helped me answer questions regarding why certain people are not able to VPN, and it allows me to verify that every remote VPN user is also performing a two-factor (comparing it with my two-factor solution). In addition, it allows me to run reports to see if a user has been authenticating from unexpected locations and allows us to investigate these logins.
Hope this helped and allows you to implement it in your organization.
As usual, leave any questions or suggestions.
Thank you.
Thanks! Great article. I will implement this in my environment.
What about monitoring traffic on internal switches
I haven’t tried, but it should be very similar