The following is a master script that was created to check on the health for Logstash and Elasticsearch nodes. This is helpful if you don’t have x-pack setup in your environment.
The Script is ran using Cron (Scheduled job) every 2 minutes and will notify you if the following happened:
- If the IP Reputation files (maliciousIP.yaml) failed to download – Reference this article to create this file.
- If Elasticsearch nodes are in a “RED” state – Meaning that logs are not coming in
- If Logstash Disk Space is running low – Log parsing will most likely stop
- If Logstash ports are not listening (5050, 5065) – Logstash is not receiving logs.
- If Plug-in Error messages are generated in the Logstash logs
Note: I’m running Centos 7, and Logstash 5.x, and Python 2.7.5
Let’s go over the prerequisites first:
- Setup AlienVaultIPReputation.py which can be accomplished by following this article
- Setup email notification for the Logstash server
- Setup a Cron job to execute the master script.
1. Setup AlienVaultIPReputation
You can follow this article and get it setup. This script allows us to pull threat feeds from AlientVault and compare them real-time with our outbound IP addresses to see if there’s any callbacks to known malicious IP addresses in Elasticsearch. This is an optional step, you may just comment out # the first portion of the master_script.sh script.
2. Setup email notification for the Logstash Server
We will first install mailx which is a fairly easy setup.
Step 1: Install mailx
|
1
|
yum install mailx
|
Step 2: Edit configuration
|
1
|
vi /etc/mail.rc
|
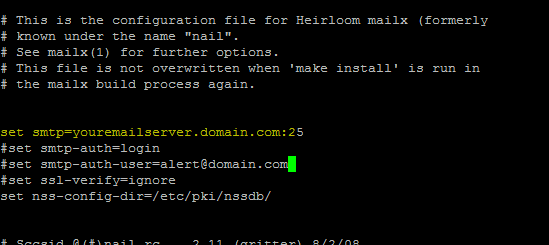
set smtp=youremailserver.domain.com:25
set nss-config-dir=/etc/pki/nssdb/
Those are really the only setting you need.
Next, you may send a test email to ensure that this works.
Run the following command:
echo “Hey this is a test email” | mailx -s “Test email” pablo@domain.com
Note: You should get an authenticated email account from your exchange administrator and enter if it’s necessary (This is more secure); otherwise, you’ll need to add a relay on your exchange server.
3. Setup a Cron job to execute the master script.
Setting up Cron
Cron is a time-based job scheduler (Think scheduled task in windows), that allows you to scheduled any kind of bash script. We will be installing it and then adding our script to ensure that it runs in an hourly basis.
Step 1: Install Cron
|
1
|
sudo yum install cronie
|
Step 2: Configure
vi /etc/crontab

*/2 * * * * root sh /home/pdelgado/master_script.sh > /home/pdelgado/master_log.txt
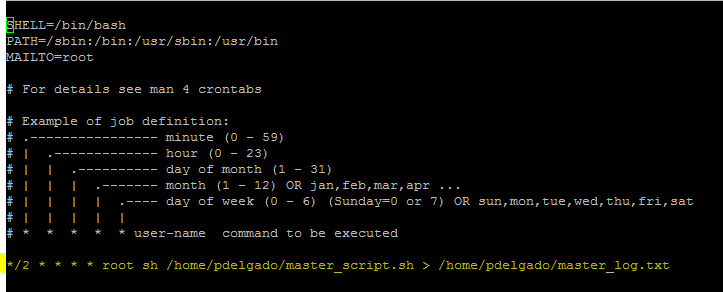
the */2 * * * * means that this script will run every 2 minutes. If you need more info on Cron you can visit this page.
Additionally when this script runs it will write the results to a master_log.txt file so you can see the results when the script runs and ensure that there are no issues.
Master Script
Finally once you have setup the prerequisites, we can finally create the master script. Copy and save as master_script.sh and ensure that you edit your cron job so you are pointing to the right location. As you saw earlier, my master script is located under /home/pdelgado/master_script.sh
#!/bin/bash

#NOTE
#enter the name of the new script file in this master file to be executed in the crone job. DO MAKE SURE THAT YOU
#DO "chmod +x script_filename.sh". This will give the script access to execute.

echo
echo "==================================== INITIATING Scripts =========================================="
echo

#1 - Checks to see that the AlienVaultIP.yaml filesize is 0kb - Meaning that the file did not download successfully
# References this setup: http://syspanda.com/index.php/2017/08/26/detecting-outbound-connections-pt-2-logstash-threat-intelligence/
# Script is located here: /opt/logstash/

cd /opt/logstash/
pwd
echo "Generating AlienVaultIP "
myfilesize=`stat -c %s AlienVaultIP.yaml`
if [ $myfilesize = 0 ];then
   echo
   echo "the file size is zero"
   python /opt/logstash/AlienVaultIPReputation.py
   echo "File AlienVaultIP.yaml was empty" | mail -v -s "Logstash : Alert" pablo@domain.com
else
   echo
   echo "The file size is normal!"
fi

echo
echo "================================================================================="
echo

#2 - Checks Elasticsearch node to see if there's any Red Indexes. Red means that there's a problem with elasticsearch indexes and no data is being sent
echo "Checking ElasticsearchServer Processes"
pwd
curl ElasticsearchServer:9200/_cat/indices?v > Status_logs.txt
grep -i -E 'red' Status_logs.txt > parsed_result.txt
if [ $? -eq 0 ] ; then
    echo "RED processes found"
    echo "Found at least 1 Red Index"| mail -s "Status : ALERT - ElasticsearchServer:9200" -q parsed_result.txt pablo@domain.com
else
    echo
    echo "Processes are running normal !"
fi

echo
echo "================================================================================="
echo


#3 - Checks Logstash for Low disk space.

echo "Checking Disk space usage"
pwd
usage=`df -h | awk '{print $5}' | head -n 2 | tail -1 | sed 's/[\.%-]//g'`
if [ $usage -ge 90 ]
then
  gigs=`df -h | awk '{print $4}' | head -n 2 | tail -1 | sed 's/[\.%-]//g'`
  echo "THE DISK SPACE IS ABOVE 90 %! Current % value : $usage , Current Gigs : $gigs" | mail -v -s "DISK USAGE : Alert - LogstashServer " pablo@domain.com
else
  echo
  echo "The disk space is normal!"
fi

echo
echo "================================================================================="
echo

#4 - Logstash - Checks for ports listening (5050 for Winlogbeats, and 5065 for Web filtering logs)

echo "Checking port status (5050 & 5065)"
pwd
netstat -plnt > netstat_log.txt
if (grep -i -E '5050' netstat_log.txt && grep -i -E '5065' netstat_log.txt); then
    echo  "Both Ports are UP !!"
else
    echo "One of the ports is DOWN"
    echo "At least one listening port has stopped. Investigate!"| mail -s "ALERT : Logstash ports down" pablo@domain.com
fi

echo
echo "================================================================================="
echo

#5 - Logstash - checks the logstash-plain.log for any Plugin errors.

echo "Checking logstash for error messages"
pwd
tail -n20 /var/log/logstash/logstash-plain.log > Status_logs.txt
grep -i -E 'A plugin had an unrecoverable error.' Status_logs.txt > parsed_result.txt
if [ $? -eq 0 ] ; then
    echo "ERROR FOUND"
	service logstash restart
    echo "Found Plug-in Error, investigate! "| mail -s "Status : ALERT - LOGSTASH Plugin Failure" pablo@domain.com
else
    echo
    echo "Logs are fine !"
fi

echo
echo "====================================== SCRIPT SEQUENCE COMPLETE ========================================"
echo

exit 0
Final Notes
As I mentioned before this is very helpful if you aren’t running x-pack, or if you aren’t using other 3rd party tool to check the health status of your ELK nodes.
This is very simple to setup and it works great to notify if there’s an issue with the ELK setup.
Thanks to Arjun for contributing to the master script.