You can’t control what you can’t see
Do you have a list of approved and trusted applications in your environment? Are you sure? What about those 3rd party add-ons that users download or those ad-ware applications bundled in those PDF converters? The reality is that we might not be tracking all of our software entirely and especially those that are not authorized to run.
It’s a scary feeling not knowing what’s currently running on your systems and how those processes got there in the first place. The purpose of this article is to take advantage of existing resources to answer these questions. We will be leveraging Sysmon, Windows Event Forwarder, and Applocker (which is available for Windows Enterprise versions only).
There are commercial products out there that can easily discover your network and provide a list of software running such as Quest KACE 1000, or even Microsoft’s SCCM among others; they can easily be deployed through GPO and make your life easier.
For now, let’s do it the manual way and get to know our environment a little better.
Windows Event Forwarder
Windows event forwarder allows us to create subscriptions (which are collections of specific event IDs that we want to collect from our endpoints). In my opinion this is the best way to collect event logs from our organization to be sent to a centralized location to review later.
You can follow this step-by-step guide to setup Windows event forwarder on any Windows 2008 or Windows 2012 server.
If you don’t have a windows server setup and just want to send your windows logs directly to elasticsearch via Logstash you can follow this guide. (Ensure that you add the following event IDs that we’re about to cover next)
What type of logs should we collect?
For the rest of this article we will focus on the following log types:
- System Event logs – The System log contains events logged by Windows system components.
- Applocker Logs – Applocker logs will display any applications that were ran in a windows system.
- Task Scheduler – Scheduled tasks will generate logs pertaining the creation/updating of tasks that are running locally on a system.
- Sysmon Logs – Sysmon logs will generate logs pertaining to process creation, processes making external connections.
- Security Event Logs – In addition to recording Logon/Log off events, security event logs also include Process Creation & Process Termination.
- Windows Firewall Logs – When applications get installed they will normally add themselves to the Windows Firewall Exception. This is a good way to identify what applications are installed, additionally these apps keep modifying themselves so it’s easier to identify.
System Event logs
System: Event IDs 7045, 4697
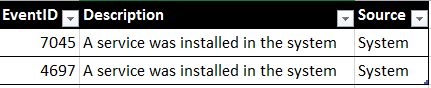
Why?: These two event IDs will allow you to see what services or applications are being installed. This will give you visibility on expected and unexpected applications that perhaps should NOT be running. Occasionally, bad actors will establish persistence to systems by registering new services and ensuring that their backdoors survive system reboots.
Applocker
Events: All events, but focusing on 8002, and 8005.
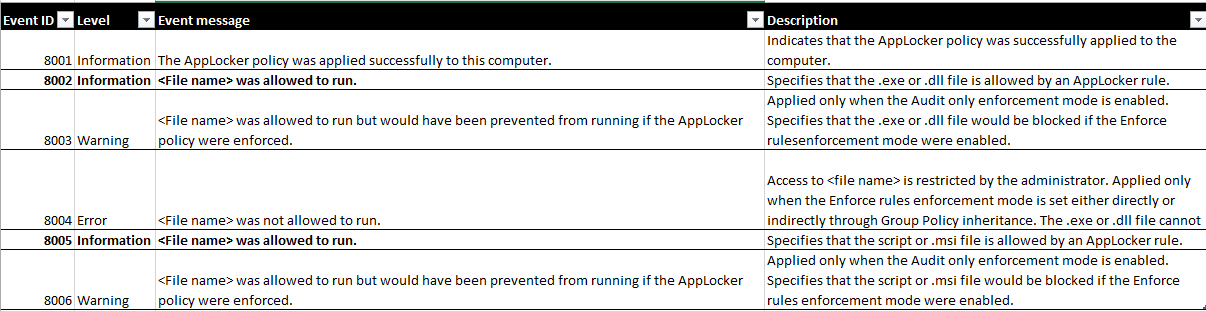
Why?: Applocker allows you to specify what applications can be ran in your environment (white-listing, or blacklisting). For our purpose, we will utilize it to see what exactly is running in our environment since at this point we only care about visibility. (Note: Applocker is only available for Enterprise versions of Windows 7)
Here’s a good guide on setting up AppLocker and below is a list of Event IDs along with descriptions. Start with audit mode first!
Task Scheduler
Events: All events or Event IDs: 106,129 141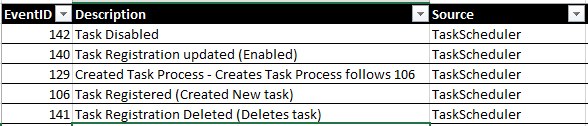
Why?: Just as we discussed with newly registered services. Adware, Bad actors, and other malware may create a new task to ensure that their malware continues to run or perform specific tasks on a set scheduled. Prepare to see many collaboration software listed here (Webex, Gotomeeting), Dropbox, Chrome updates, Adobe updates). This will also give you an idea of what software is currently installed/running on your endpoints.
Sysmon
System Monitor (Sysmon) is a Windows system service and device driver that, once installed on a system, remains resident across system reboots to monitor and log system activity to the Windows event log
Events: suggested Event IDs 1,3
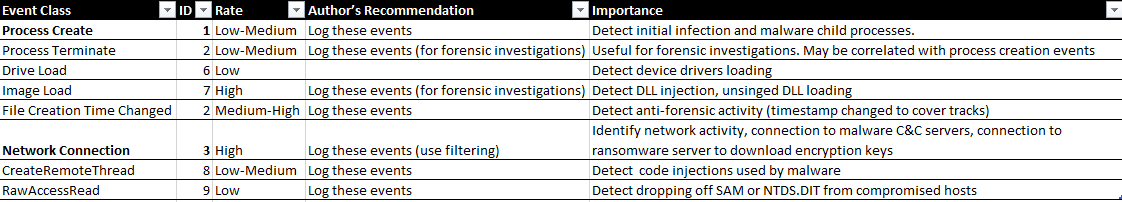
Why? Since Sysmon can log any system activities, it allows us to see any new processes that are starting, and will also detect if there’s software making outbound connections. This will allow you to investigate any potential malware making callbacks to their C&C servers for malicious payloads.
More info on setting up Sysmon on your endpoints, or deploying it through GPO to multiple systems.
Security Event Logs
Additionally you can also include the following Event IDs from the Windows Security Event Logs:
- Event ID: 4688 – Process Creation (Similar to Sysmon Event ID 1)
- Event ID: 4689 – Process Termination
Windows Firewall Logs
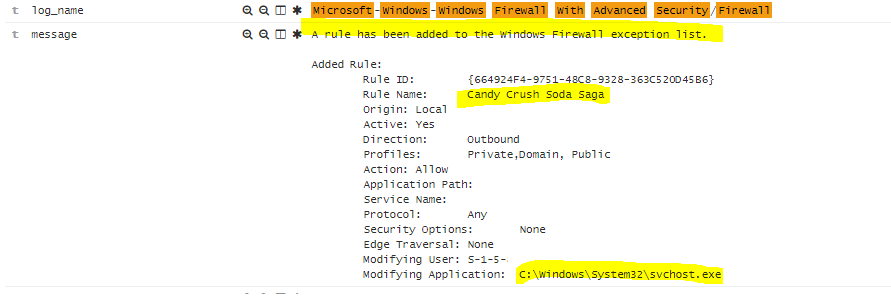
- Event ID: 2004 – A rule has been added to the Windows Firewall exception list.
- Event ID: 2005 – A rule has been modified in the Windows Firewall exception list.
- Event ID: 2006 – A rule has been deleted in the Windows Firewall exception list.
Why?: New applications will attempt to modify the Windows Host-based firewall to ensure that they can connect, specially if they’re communicating in a specific port.
(This will collect the Rule name, and the modifying application path.)
Let’s investigate: Basic scenarios
Assuming that you were able to start collecting these logs and sending them over to your ElK stack, we can now start creating some meaningful dashboards and start discovering exactly what is going on in our environment.
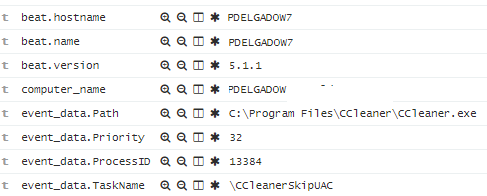
On my Kibana Dashboard I was able to create a view of my environment and noticed that Cclearner.exe has a scheduled task created.
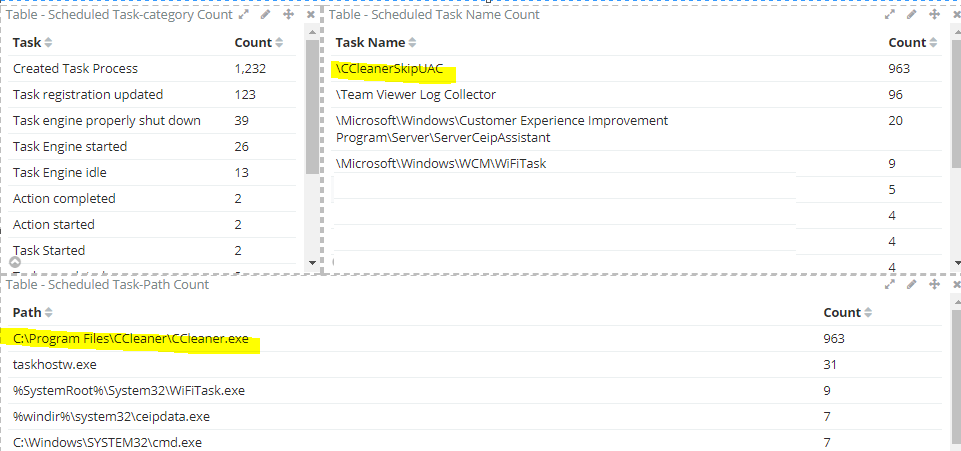
I can then investigate and see what computer system has this software installed.
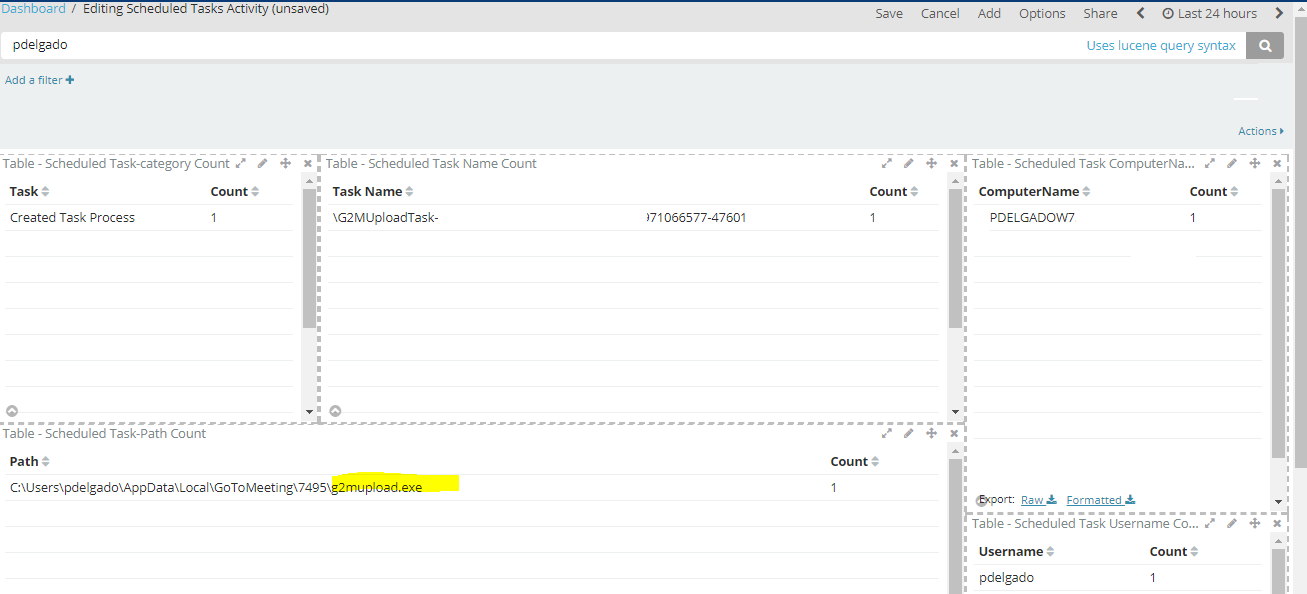
I can also just search for my userid and see what other scheduled tasks are associated to my login:
Here’s a sysmon one which shows me all the processes that have been ran in the past 2 days, along with any network connections.
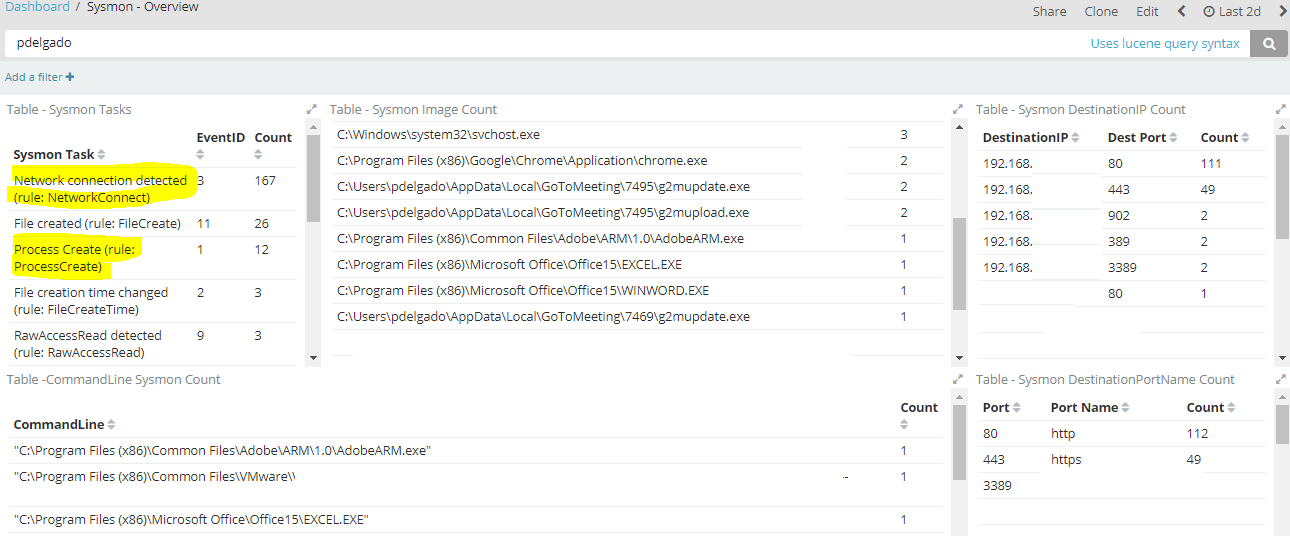
I know my system is running excel, chrome, word, adobe reader. I can also see that gotomeeting is running in the background and I might just decide to uninstall it. As you saw earlier, Gotomeeting has some scheduled tasks, most likely dealing with software updates; however, this could have also been a malicious application running in the background.
Lastly, here’s a screenshot of newly registered services:
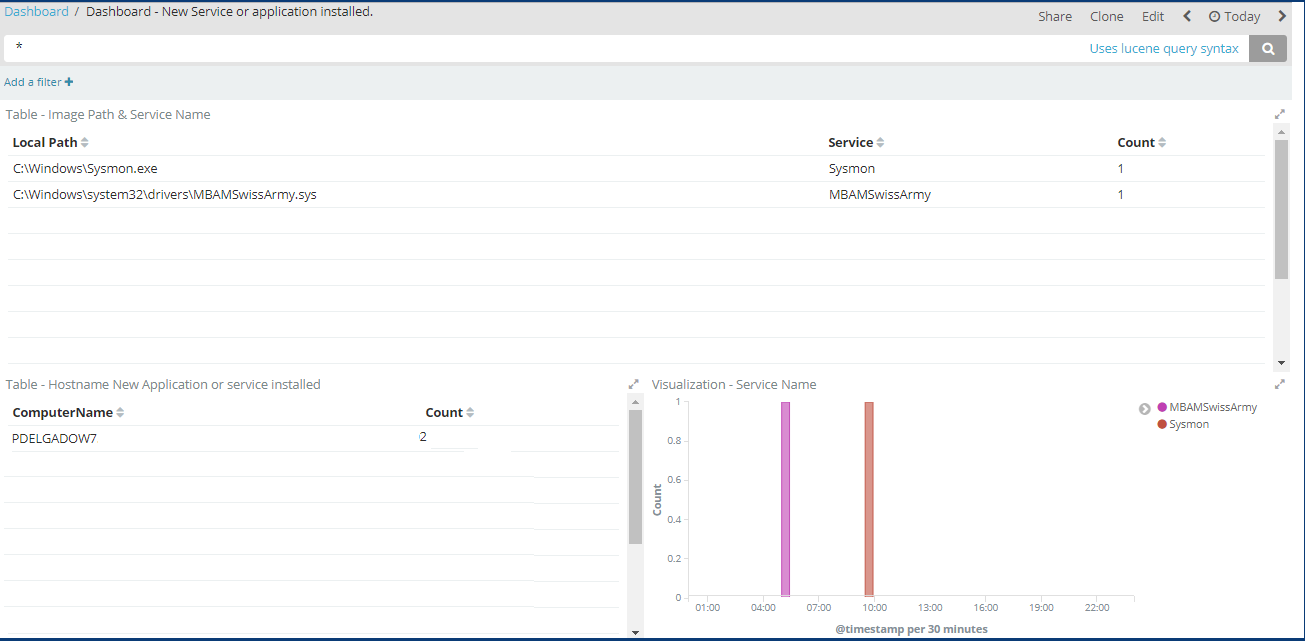
I know I installed Sysmon; however, I wasn’t aware that Malwarebytes (MBAMSwissArmy) had possibly received an upgrade silently and registered as a new service. Or this could have been a fake service pointing to another executable.
So what’s the point of all of this?
As I mentioned before, if you really want to protect your systems, you have to make sure you are logging the interesting things in your environment and proactively looking at them to establish a “norm”. This “norm” can be your day-to-day applications, or those applications that allowed for your users at your organization and quickly know if there’s any third-party applications running or potential malware. Additionally, this is a low-cost (or in some instances no cost) solution to provide you with real-time endpoint logging and allow you to be more proactive about protecting your environment.
If you have any questions or comments let me know. I can also answer them via twitter
Thanks for reading!
Since you read this far, I will show you how I created the dashboards shown before using Kibana (assuming that you are sending this data through Winlogbeat > ELK).
Creating a dashboard for Scheduled Task.
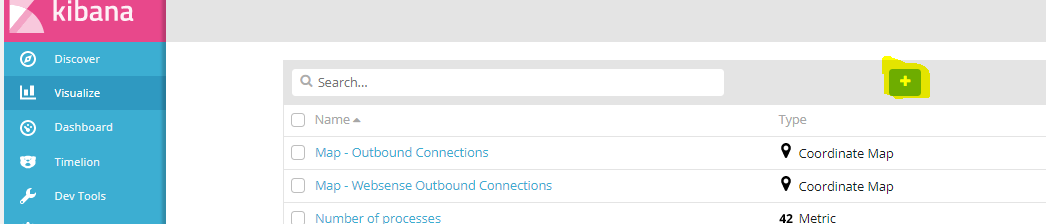
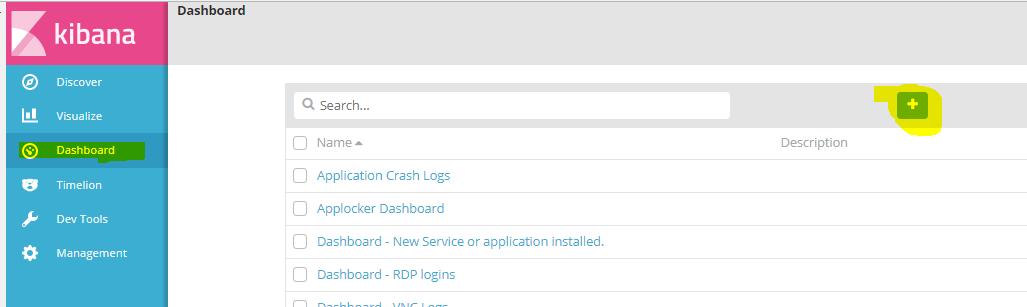
Navigate to your Kibana dashboard and go to “visualize”.
Click the “+” to select a visualization type.
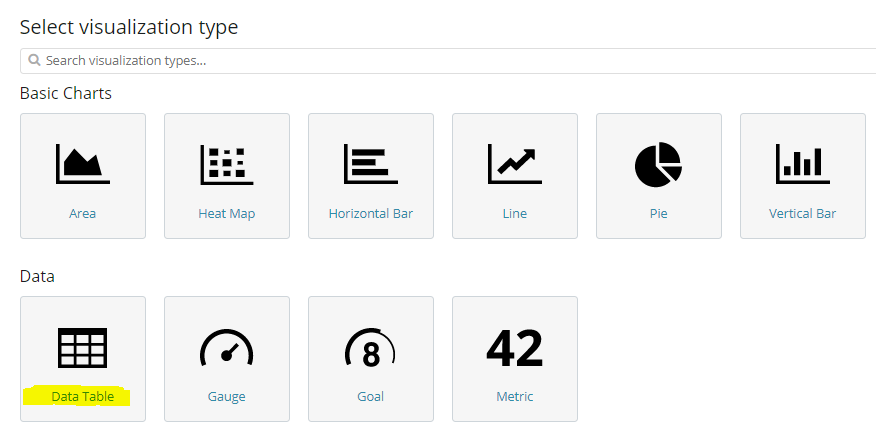
Select “Data Table”
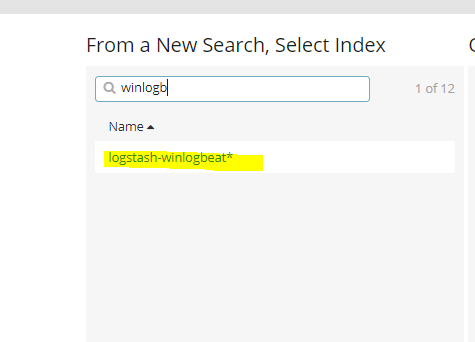
Lastly, select your index pattern or saved search.
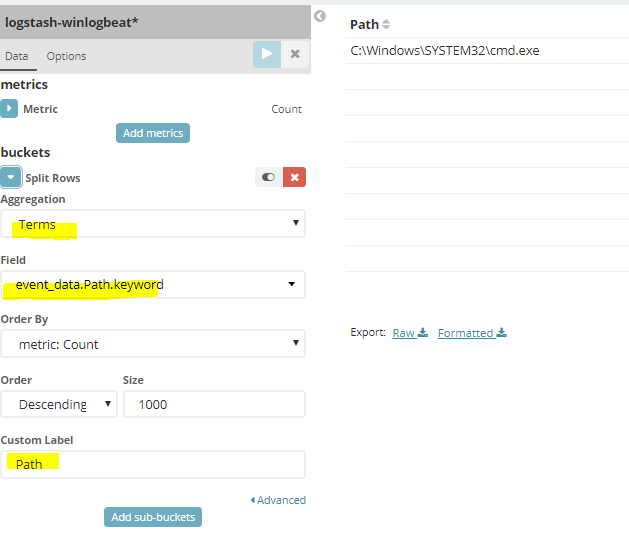
Set your values to the screenshot shown next:
Aggregation:Terms
Field: Task.keyword
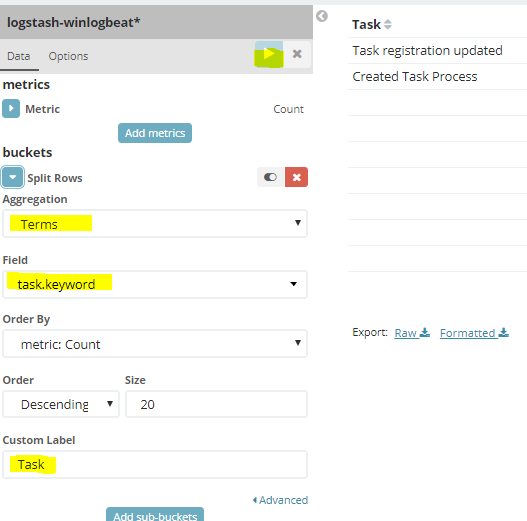
Test it by clicking the ![]() icon to ensure that your field is generating data.
icon to ensure that your field is generating data.
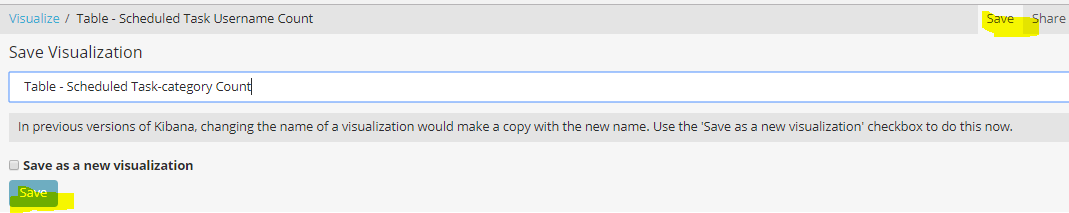
Lastly, save it and provide a meaningful name, such as: Table – Scheduled Task Name
Repeat these steps:
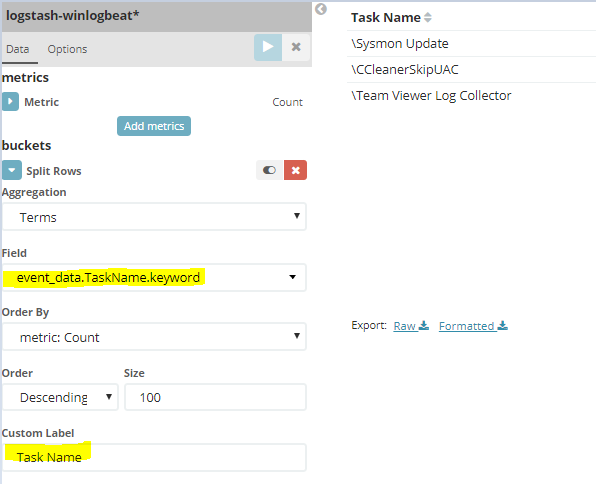
Again, match your values to the screenshot below:
Aggregation: Terms
Field: event_data.TaskName.keyword
Aggregation:Terms
Field: event_data.Path.keyword
Here’s additional ones that I created for Scheduled Tasks:
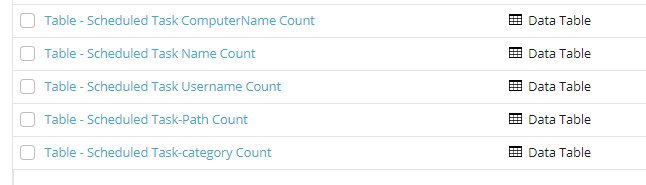
Table – Scheduled Task Username Count
Aggregation:Terms
Field: user.name.keyword
Table – Scheduled Task ComputerName Count
Aggregation:Terms
Field:computer_name.keyword
Once you have all of these visualizations created, you can create a dashboard to add them all.
Creating a Dashboard
Navigate to Dashboard and click the “+”
On the top right click on “Add”. This will allow us to browse for the visualizations we just created.
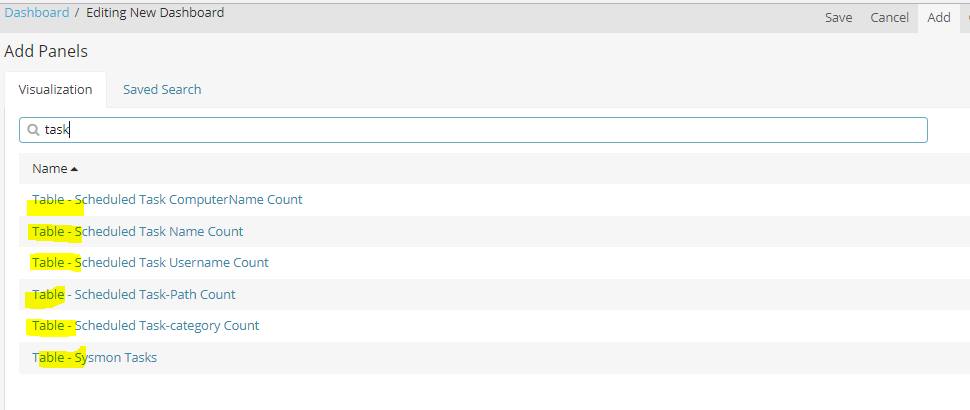
Add all of your visualizations to your dashboard. (As you can see it helps to keep a standardized naming convention for related items)
Play around with customizing your view and once you are satisfied, save it!
You can repeat these steps for the Applocker and Sysmon visualizations.
Here’s a sysmon example:
Processes making outbound connections:
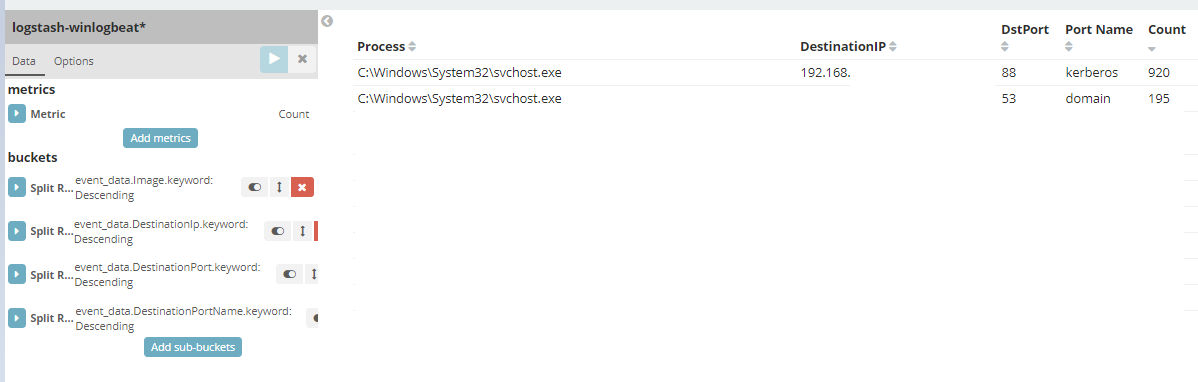
Custom Label: Process
Aggregation:Terms
Field:events_data.Image.keyword
Custom Label: DestinationIP
Aggregation:Terms
Field: events_data.DestinationIp.keyword
Custom Label: DstPort
Aggregation:Terms
Field:events_data.DestinationPort.keyword
Custom Label: Port Name
Aggregation:Terms
Field: events_data.DestinationPortName.keyword
Come up with your own use cases and create the dashboards based on that.
… [Trackback]
[…] Informations on that Topic: syspanda.com/index.php/2017/08/25/critical-control-2/ […]