Now that you have your Elasticsearch Stack setup on multiple servers or a single server it’s time to start sending some data over.
Prerequisites:
- Winlogbeat – Download here (64-bit)
- Windows hosts – Your system in which we will be collecting the logs from.
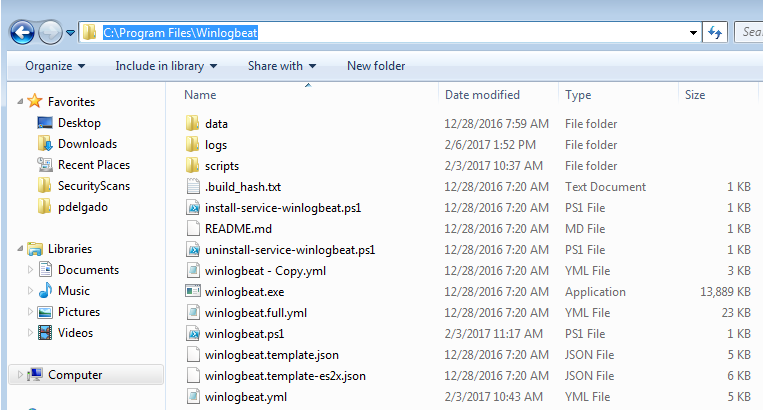
Step 1: Download and extract winlogbeat.zip to c:\program files\ (Should look like the image below)
Step 2: Open the winlogbeat.yml and edit with notepad:
We will add the following under winlogbeat.event_logs:
winlogbeat.event_logs:
  - name: Security
    event_id: 4740,4728,4732,4756,4735,4724,4625,4648,1102,4624,5038,6281
    ignore_older: 72h
  - name: Application
    event_id: 1000,1002,1001
    ignore_older: 72h
  - name: "Microsoft-Windows-TaskScheduler/Operational"
    event_id: 141,106,142,140,129
    ignore_older: 72h
  - name: System
    event_id: 104,102,1102,4719,6005,7022,7023,7024,7025,7026,7031,7032,7034,7045,4697,7022,7023,104,6
    ignore_older: 72h
  - name: "Microsoft-Windows-Application-Experience/Program-Inventory"
    event_id: 903,904
    ignore_older: 72h
  - name: "Microsoft-Windows-Sysmon/Operational"
    ignore_older: 72h
  - name: "Microsoft-Windows-TerminalServices-RDPClient/Operational,Microsoft-Windows-TerminalServices-LocalSessionManager/Admin,Microsoft-Windows-TerminalServices-LocalSessionManager/Operational"
    event_id: 23,24,25,1102
    ignore_older: 72h
  - name: "Microsoft-Windows-Windows Firewall With Advanced Security/ConnectionSecurity,Microsoft-Windows-Windows Firewall With Advanced Security/ConnectionSecurityVerbose,Microsoft-Windows-Windows Firewall With Advanced Security/Firewall,Microsoft-Windows-Windows Firewall With Advanced Security/FirewallVerbose,Microsoft-Windows-Windows Firewall With Advanced Security/Network Isolation Operational"
    event_id: 2004,2005,2006,2033,2009
    ignore_older: 72h
  - name: "Microsoft-Windows-WindowsUpdateClient/Operational"
    event_id: 20,24,25,31,34,35
    ignore_older: 72h
(Note: I’m monitoring various aspects of the windows host including Sysmon which we will install later, at the end of this article you may see a table with a list of Event ID’s along with a description of what they are).
Next, scroll down until you get to output.logstash: here you will add your logstash server information
output.logstash:
  # The Logstash hosts
  hosts: ["elkorlogstashipaddress:5044"]
  index: winlogbeat
Save the winlogbeat.yml and exit.
Step 3: Install Winlogbeat as a service
Launch Powershell (Run as Administrator) – and enter the following:
cd "C:\Program Files\Winlogbeat"
powershell.exe -ExecutionPolicy UnRestricted -File .\install-service-winlogbeat.ps1
Start-Service winlogbeat
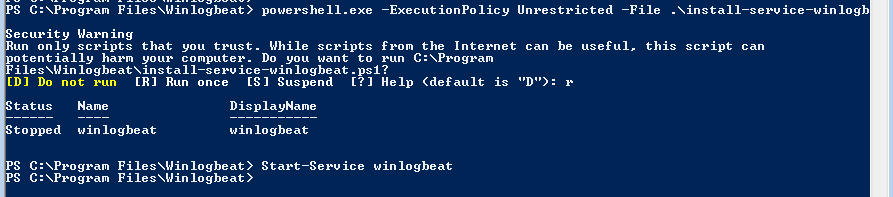
Verify that the service is running.
Done! Next tutorial will focus on Kibana so you may start visualizing the data.
Below is a list of Event IDs along with a description. I have a longer list saved; however, these are the ones I believe should be monitored.
Security Logs:
| EventID | Description | Source |
| 4756 | A member was added to a security-enabled universal group | Security |
| 4740 | A User account was Locked out | Security |
| 4735 | A security-enabled local group was changed | Security |
| 4732 | A member was added to a security-enabled local group | Security |
| 4728 | A member was added to a security-enabled global group | Security |
| 4724 | An attempt was made to reset an accounts password | Security |
| 4648 | A logon was attempted using explicit credentials | Security |
| 4625 | An account failed to log on | Security |
| 1102 | The Audit Log was cleared | System |
| 4624 | An accout was successfully logged on | Security |
| 4634 | An account was logged off | Security |
| 5038 | Detected an invalid image hash of a file | Security |
| 6281 | Detected an invalid page hash of an image file | Security |
Application Logs
| EventID | Description | Source | Log Name |
| 1000 | Application Error | Application | |
| 1002 | Application Hang- Crash | Application | |
| 1001 | Application Error – Fault Bucket | Application | |
| 1 | EMET | ||
| 2 | EMET |
System:
| EventID | Description | Source |
| 104 | Event Log Cleared | System |
| 1102 | The Audit Log was cleared | System |
| 4719 | System Audit Policy was changed | System |
| 6005 | Event log Service Stopped | System |
| 7022-7026,7031,7032,7034 | Windows Services Fails or crashes | System |
| 7045 | A service was installed in the system | System |
| 4697 | A service was installed in the system | System |
| 7022 | EVENT_SERVICE_START_HUNG | System |
| 7023 | EVENT_SERVICE_EXIT_FAILED | System |
| 104 | Event log was cleared | System |
| 6 | New Kernel Filter Driver | System |
Firewall
| EventID | Description | Source | Log Name |
| 2005 | A Rule has been modified in the WindowS firewall Exception List | Firewall | Microsoft-Windows-Windows Firewall With Advanced Security/Firewall |
| 2004 | Firewall Rule Add | ||
| 2006, 2033 | Firewall Rules Deleted | ||
| 2009 |
Terminal Services
| EventID | Description | Source | Log Name |
| 23 | Session Logoff Scceeded | TerminalServices-LocalSessionManager | Microsoft-Windows-TerminalServices-LocalSessionManager/Operational |
| 24 | Session has been disconnected | TerminalServices-LocalSessionManager | Microsoft-Windows-TerminalServices-LocalSessionManager/Operational |
| 25 | Session Reconnection Succeded | TerminalServices-LocalSessionManager | |
| 1102 | Client has initiated a multi-transport connection | TerminalServices-ClientActiveXCor | Microsoft-Windows-TerminalServices-RDPClient/Operational |
If you have any questions feel free to send me a message on Twitter where I’ll answer quicker.
Update 8-10-2017: Microsoft has an article pertaining their suggested Events to monitor which is very useful, it can be accessed here
I am so thankful for this post! I couldn’t for the life of me get my sysmon logs to show up in Elasticearch. Was able to fix it by following your guide. Thank you!!