Since I’ve struggled to get McAfee ePO to send syslogs to my ELK environment, I decided to leverage the SQL JDBC driver and logstash JDBC plug-in to pull threat records from ePO to better integrate it with my other dashboards. This tutorial will allow you to pull up-to-date threat events from your ePO database server into Elasticsearch from a Windows System (Linux article will follow soon).
The following are prerequisites to setup a Logstash configuration for Windows:
- Download and install Java JDK
- Set Java_Home folder
- Download SQL JDBC Driver– Downloads version 6.0.8112.2 (make sure you extract this)
- Download Logstash – For this example I’m using 6.2.3 (download and extract)
- Create a Local SQL Read-only account for your McAfee ePO Database
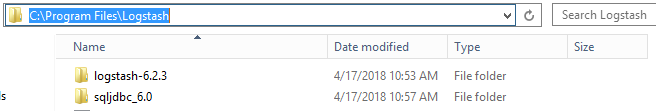
I’ve extracted these files and copied them to c:\Program Files\Logstash
- Logstash-6.2.3
- sqljdbc_6.0
Once you have installed and setup Java SDK and have extracted the files needed to your preferred location, you may move on to the following:
Creating a McAfee Logstash Configuration
We will be creating a Logstash configuration that will query our SQL database using the locally created SQL account (SQL Integrated security won’t work). This will query the SQL database and only pull new records that get generated throughout the day.
What does the following configuration do?
- Queries the McAfee SQL Db for fields such as: workstation name, AnalyzerName, Version, OS information, User information, Threat information such as source/destination process. You should test the query in SQL Management studio and select the fields you deem important.
- Since Events are UTC, I’m converting them to central time (CT).
- I’m also just querying today’s events only and limiting to 50k records
- Setting “autoid” to keep track of the latest event id, to ensure that when the query runs, only newly created records are being added to elasticsearch.
input {
  jdbc {
   jdbc_driver_library => "C:\Program Files\Logstash\sqljdbc_6.0\enu\jre8\sqljdbc42.jar"
   jdbc_driver_class => "com.microsoft.sqlserver.jdbc.SQLServerDriver"
   jdbc_connection_string => "jdbc:sqlserver://YOURSQLSERVER:1433;databaseName=EPODATABASE"
   jdbc_user => ""
   jdbc_password_filepath => "C:\YourPathtoyourpassword\password.txt
   statement => "SELECT
EPOEvents.AutoID as autoid,
dateadd(hour,-5,EPOEvents.DetectedUTC) as generatedtime,
CONVERT(varchar, dateadd(hour,-5,EPOEvents.ReceivedUTC),0) as ReceivedTime,
EPOComputerProperties.DomainName,
EPoEvents.SourceUserName,
EPOEvents.AnalyzerName,
EPOEvents.AnalyzerVersion,
EPOEvents.AnalyzerDATVersion,
EPOEvents.AnalyzerEngineVersion,
EPOEvents.AnalyzerDetectionMethod,
EPOEvents.AnalyzerHostName[McComputerName],
EPOComputerProperties.IPAddress[IPAddress],
EPOComputerProperties.OSType[OperatingSystem],
EPOComputerProperties.OSServicePackVer[OSServicePack],
EPOEvents.SourceProcessName,
EPOEvents.ThreatCategory,
EPOEvents.TargetFileName,
EPOEvents.TargetUserName,
EPOEvents.ThreatName[Action],
EPOEvents.ThreatType,
EPOEvents.ThreatActionTaken,
EPOEvents.ThreatHandled,
EPOEventFilterDesc.Name,
EPOEventFilterDesc.Description
FROM            EPOEvents INNER JOIN
                         EPOEventFilterDesc ON EPOEvents.ThreatEventID = EPOEventFilterDesc.EventId INNER JOIN
                         EPOComputerProperties ON EPOEvents.AnalyzerHostName = EPOComputerProperties.ComputerName
						 where Language = '0409'

and ThreatCategory !='mail.filter'
and ThreatCategory not like 'ops.task%'
and EPOEvents.DetectedUTC >= CAST(GETDATE() AS DATE)
and EPOEvents.AutoID > :sql_last_value
"

   jdbc_paging_enabled => "true"
   jdbc_page_size => "50000"
# added the following
   use_column_value => true
   tracking_column => "autoid"

   }
 }


filter {
  mutate {
    convert => { "generatedtime" => "string" }
  }
date {
    match => ["generatedtime", "yyyy-MM-dd'T'HH:mm:ss'.'SSS'Z'"]
	timezone => "UTC"
    target => "@timestamp"
}
}


output {
 elasticsearch {
 hosts => ["http://elasticsearch:9200"]
index => "logstash-yourindexname-%{+xxxx.ww}"
 manage_template => true
 document_id => "%{autoid}"
 }
 stdout { codec => rubydebug }
}
Things to note:
- Ensure that you add the SQL JDBC path on Line # 3: in this case I’ve placed mine under “C:\Program Files\Logstash\sqljdbc_6.0\enu\jre8\sqljdbc42.jar”
- Enter your SQL Server name and Database name under jdbc_connection_string. If you’re running in a cluster, do the cluster server name followed by the database name itself.
- Enter your jdbc_user and create a text file with your password (You can set permissions to a specific user as this is clear-text and anyone can read it). Alternatively, you can always add jdbc_password “yourpassword” if you don’t care about including it in the configuration.
Save your configuration under C:\Program Files\Logstash\logstash-6.2.3\config or your preferred location.
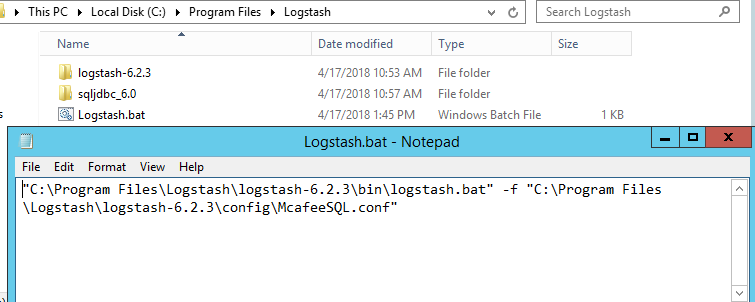
You may now run your McAfee ePO logstash configuration by running the following from Command Prompt:
“C:\Program Files\Logstash\logstash-6.2.3\bin\logstash.bat” -f “C:\Program Files\Logstash\logstash-6.2.3\config\McafeeSQL.conf”
I’ve saved this in a .bat file and saved it to c:\Program Files\Logstash
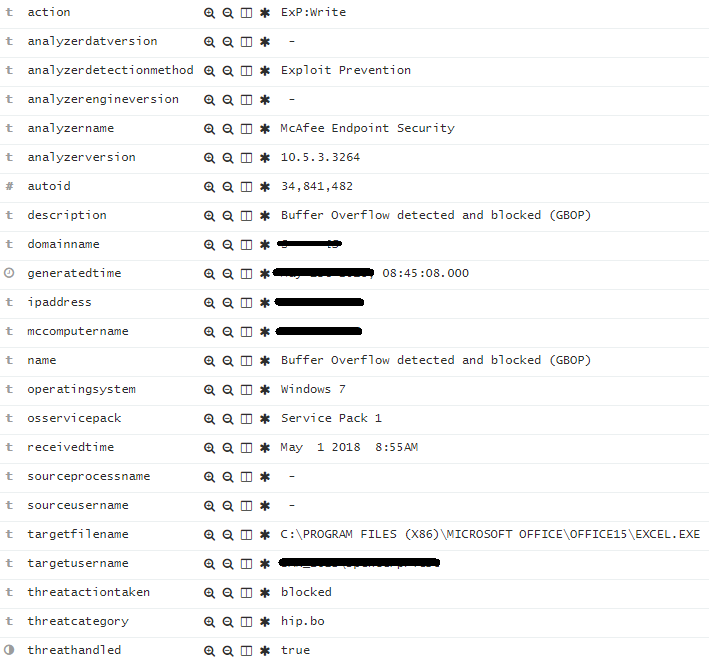
Here’s an example of a record in Elasticsearch:
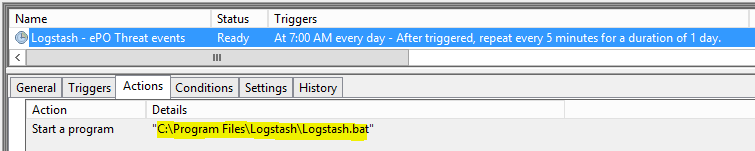
Lastly, I created a scheduled task to run every 5 minutes to pull newly created records. As mentioned, it will only query today’s events and will import only newly events that are not in Elasticsaerch.
That is all, you may use your creativity and create your own threat dashboards to help you correlate data easily.
Challenges
- I had a difficult time importing only new records as it would re-import all records. This was solved by adding the tracking column “autoid”, since each new record will have a new ID, so at the end it became fairly easy to identify a unique table that helped with this.
- I could not get the timestamp to match with the records generated. For this I had to convert the generatedtime to a string and match it with the @timestamp.
- Lastly, I wanted to display the records in Central Time; however, Kibana would display them differently, so I ended up converting them to UTC so Kibana would display them in Central time which is what I wanted.
Thanks for reading and let me know if you have any questions about this setup.
Why you did not grab the hash of the process source an destination and globally more metadata ?
Thanks
I have to look at all the available field names and perhaps include the hash information too, thanks for the suggestion.
And to complete you are using mcafee ENS and not Virusscan
Technically it’s still using the VirusScan Enterprise Analyzer for detection.